
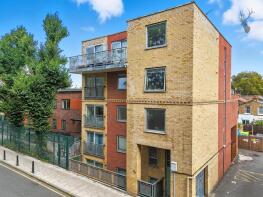
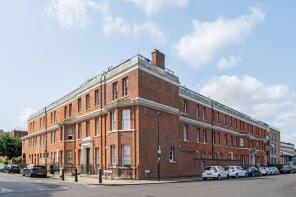
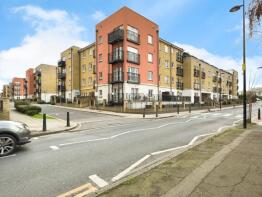
House Prices in E1
House prices in E1 have an overall average of £536,723 over the last year.
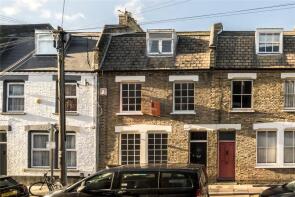
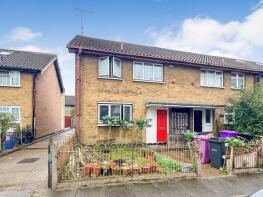
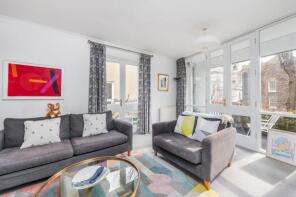
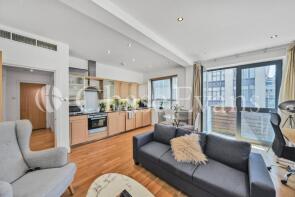
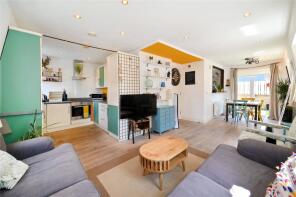
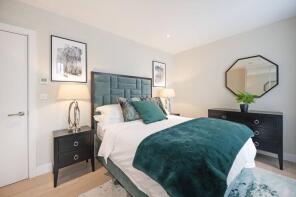
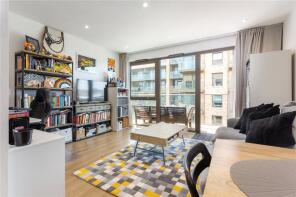
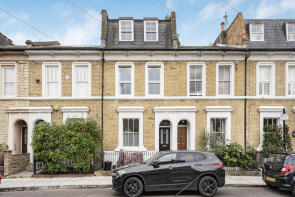
The majority of properties sold in E1 during the last year were flats, selling for an average price of £502,617. Terraced properties sold for an average of £825,087, with detached properties fetching £930,000.
Overall, the historical sold prices in E1 over the last year were 3% down on the previous year and 25% down on the 2019 peak of £714,715.
Properties Sold
5, Coopers Close, London E1 4BB
| Today | See what it's worth now |
| 17 Apr 2026 | £500,000 |
| 13 Mar 2002 | £165,000 |
No other historical records.
Flat 8, 62 64, Globe Road, London E1 4DS
| Today | See what it's worth now |
| 17 Apr 2026 | £448,500 |
| 23 Jul 2010 | £265,000 |
No other historical records.
Flat 3, 233 Crownage House, Mile End Road, London E1 4AA

| Today | See what it's worth now |
| 16 Apr 2026 | £317,000 |
| 25 Sep 2015 | £325,000 |
No other historical records.
Extensions and planning permission in E1
See planning approval stats, extension build costs and value added estimates.

43, Senrab Street, London E1 0QF
| Today | See what it's worth now |
| 15 Apr 2026 | £830,000 |
| 26 Jan 2007 | £435,000 |
No other historical records.
Flat 60, 1, Prescot Street, London E1 8RJ
| Today | See what it's worth now |
| 14 Apr 2026 | £340,000 |
| 21 Jul 2003 | £185,000 |
Apartment 31, 3 Courtyard Apartments, Avantgarde Place, London E1 6GU
| Today | See what it's worth now |
| 10 Apr 2026 | £462,500 |
| 27 Nov 2013 | £373,000 |
No other historical records.
Flat 1, Fisher House, Cable Street, London E1 0AW
| Today | See what it's worth now |
| 10 Apr 2026 | £400,000 |
| 17 Mar 2006 | £190,000 |
No other historical records.
Flat 4, 74 Justice Apartments, Aylward Street, London E1 0ER
| Today | See what it's worth now |
| 8 Apr 2026 | £440,000 |
| 10 May 2011 | £370,000 |
No other historical records.
Flat 32, 49 Stepney City Apartments, Clark Street, London E1 3HS
| Today | See what it's worth now |
| 7 Apr 2026 | £390,000 |
| 22 Jun 2004 | £130,000 |
No other historical records.
Flat 109, 37 Dryden Building, Commercial Road, London E1 1LF
| Today | See what it's worth now |
| 1 Apr 2026 | £420,000 |
| 21 Aug 2000 | £207,500 |
No other historical records.
Flat 2, 17 Apex House, Bacon Street, London E1 6LF
| Today | See what it's worth now |
| 30 Mar 2026 | £695,000 |
| 27 Mar 2012 | £470,000 |
No other historical records.
9, Coopers Close, London E1 4BB
| Today | See what it's worth now |
| 30 Mar 2026 | £375,000 |
| 1 Mar 2013 | £260,000 |
16, Newbold Cottages, Sidney Street, London E1 2HJ
| Today | See what it's worth now |
| 30 Mar 2026 | £475,000 |
| 30 Aug 2007 | £305,000 |
No other historical records.
6, Hawksmoor Mews, London E1 0DG
| Today | See what it's worth now |
| 27 Mar 2026 | £605,000 |
No other historical records.
Flat 6, Prospero House, Portsoken Street, London E1 8BZ
| Today | See what it's worth now |
| 27 Mar 2026 | £357,400 |
| 1 Sep 1999 | £167,500 |
No other historical records.
Flat 7, 84, Middlesex Street, London E1 7EZ
| Today | See what it's worth now |
| 26 Mar 2026 | £2,100,000 |
| 21 Mar 2006 | £950,000 |
Flat 4, 29 Nook Apartments, Scarborough Street, London E1 8DR
| Today | See what it's worth now |
| 26 Mar 2026 | £612,500 |
| 27 Sep 2017 | £633,000 |
Flat 2, 7 Gray Court, Candle Street, London E1 4RT
| Today | See what it's worth now |
| 24 Mar 2026 | £295,000 |
| 25 Mar 2011 | £230,000 |
No other historical records.
Flat 2, Roccoco House, Princelet Street, London E1 5LP
| Today | See what it's worth now |
| 20 Mar 2026 | £773,000 |
| 12 Oct 2022 | £900,000 |
Flat 1, 110, Brick Lane, London E1 6RL
| Today | See what it's worth now |
| 20 Mar 2026 | £575,000 |
| 6 Nov 2009 | £449,000 |
No other historical records.
Flat 301, 20 Alpha Court, Calvin Street, London E1 6HF
| Today | See what it's worth now |
| 19 Mar 2026 | £397,000 |
| 20 Jun 2013 | £380,000 |
No other historical records.
Flat 7, 68 Gatsby Apartments, Wentworth Street, London E1 7BB
| Today | See what it's worth now |
| 19 Mar 2026 | £875,000 |
| 25 Mar 2019 | £1,080,000 |
No other historical records.
Flat 503, 18 Rigel House, Hemming Street, London E1 5GB
| Today | See what it's worth now |
| 17 Mar 2026 | £455,000 |
| 26 Jul 2019 | £490,000 |
No other historical records.
Source Acknowledgement: © Crown copyright. England and Wales house price data is publicly available information produced by the HM Land Registry.This material was last updated on 9 July 2026. It covers the period from 1 January 1995 to 30 April 2026 and contains property transactions which have been registered during that period. Contains HM Land Registry data © Crown copyright and database right 2026. This data is licensed under the Open Government Licence v3.0.
Disclaimer: Rightmove.co.uk provides this HM Land Registry data "as is". The burden for fitness of the data relies completely with the user and is provided for informational purposes only. No warranty, express or implied, is given relating to the accuracy of content of the HM Land Registry data and Rightmove does not accept any liability for error or omission. If you have found an error with the data or need further information please contact HM Land Registry.
Permitted Use: Viewers of this Information are granted permission to access this Crown copyright material and to download it onto electronic, magnetic, optical or similar storage media provided that such activities are for private research, study or in-house use only. Any other use of the material requires the formal written permission of Land Registry which can be requested from us, and is subject to an additional licence and associated charge.
Rightmove takes no liability for your use of, or reliance on, Rightmove's Instant Valuation due to the limitations of our tracking tool listed here. Use of this tool is taken entirely at your own risk. All rights reserved.