House Prices in E8
House prices in E8 have an overall average of £668,670 over the last year.
The majority of properties sold in E8 during the last year were flats, selling for an average price of £576,510. Terraced properties sold for an average of £1,091,750, with semi-detached properties fetching £1,941,259.
Overall, the historical sold prices in E8 over the last year were 7% down on the previous year and 11% down on the 2022 peak of £755,441.
Properties Sold
Flat 21, 1, Helmsley Street, Hackney, London E8 3FX
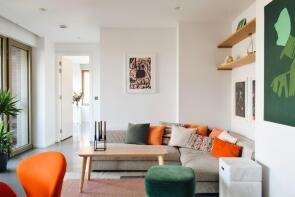
| Today | See today's value |
| 19 Aug 2026 | £590,000 |
| 5 Dec 2017 | £630,000 |
No other historical records.
Flat 48, 57, Kingsland High Street, Hackney, London E8 2FA

| Today | See today's value |
| 17 Aug 2026 | £410,000 |
| 6 Dec 2017 | £481,000 |
No other historical records.
Flat A, 45, Colvestone Crescent, Hackney, London E8 2LG
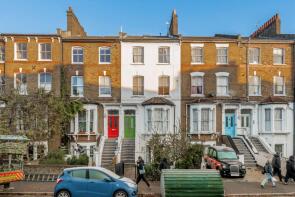
| Today | See today's value |
| 17 Aug 2026 | £521,000 |
| 14 Oct 2011 | £245,000 |
Extensions and planning permission in E8
See planning approval stats, extension build costs and value added estimates.
Flat 24, 4 14 Spur House, Spurstowe Terrace, Hackney, London E8 1LT

| Today | See today's value |
| 10 Aug 2026 | £1,000,000 |
| 6 Jun 2023 | £950,000 |
No other historical records.
Flat 11, 325 Fortune Court, Queensbridge Road, Hackney, London E8 3AP
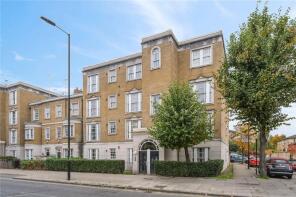
| Today | See today's value |
| 5 Aug 2026 | £522,500 |
| 27 Sep 2013 | £365,000 |
Flat F, 72-74, Albion Drive, Hackney, London E8 4LY
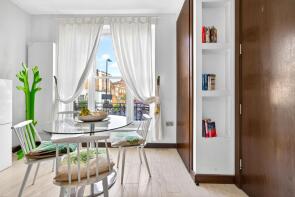
| Today | See today's value |
| 4 Aug 2026 | £550,000 |
| 9 May 2014 | £360,000 |
No other historical records.
Flat 4, 453 Welbury Court, Kingsland Road, Hackney, London E8 4AU

| Today | See today's value |
| 4 Aug 2026 | £441,000 |
| 27 Jan 2011 | £249,500 |
Flat C, 183, Graham Road, Hackney, London E8 1PD

| Today | See today's value |
| 3 Aug 2026 | £460,000 |
No other historical records.
134b, Lansdowne Drive, Hackney, London E8 4NF
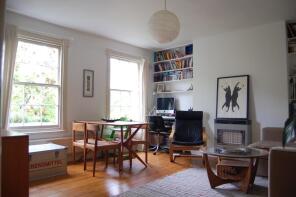
| Today | See today's value |
| 1 Aug 2026 | £450,000 |
| 21 Jan 2011 | £290,000 |
Flat 6, 39, Gransden Avenue, Hackney, London E8 3QA
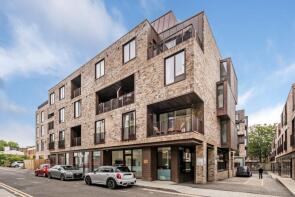
| Today | See today's value |
| 31 Jul 2026 | £840,000 |
| 23 Aug 2018 | £885,000 |
No other historical records.
Flat A, 358, Queensbridge Road, Hackney, London E8 3AR
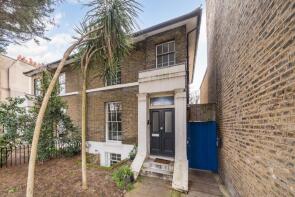
| Today | See today's value |
| 31 Jul 2026 | £875,000 |
| 16 Nov 2022 | £765,000 |
Flat 2, 1 Roman Apartments, Silesia Buildings, Hackney, London E8 3PX

| Today | See today's value |
| 30 Jul 2026 | £550,000 |
| 23 Aug 2013 | £380,000 |
19, Wyles House, Prodigal Square, Hackney, London E8 1FU

| Today | See today's value |
| 30 Jul 2026 | £580,000 |
| 29 May 2020 | £567,000 |
No other historical records.
Flat 8, Saffron House, Ramsgate Street, Hackney, London E8 2FH
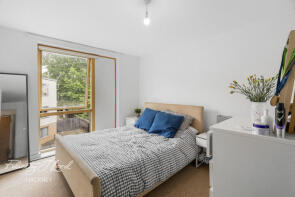
| Today | See today's value |
| 29 Jul 2026 | £540,000 |
| 5 Sep 2023 | £527,500 |
No other historical records.
Flat 3, 319 Palladium Court, Queensbridge Road, Hackney, London E8 3AJ
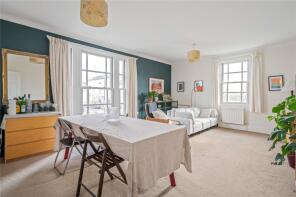
| Today | See today's value |
| 27 Jul 2026 | £630,000 |
| 25 Sep 2009 | £295,000 |
14, Atlas Mews, Hackney, London E8 2NE
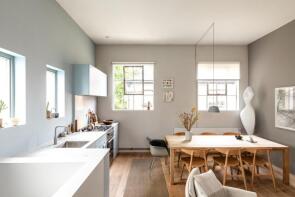
| Today | See today's value |
| 27 Jul 2026 | £758,000 |
| 19 Jan 2016 | £680,000 |
Flat C, 50, Montague Road, Hackney, London E8 2HW

| Today | See today's value |
| 24 Jul 2026 | £925,000 |
| 28 Jul 2021 | £416,000 |
No other historical records.
10, Middleton House, Middleton Road, Hackney, London E8 4LW
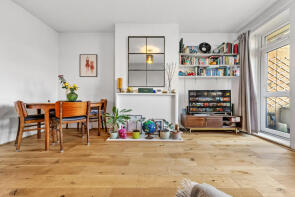
| Today | See today's value |
| 23 Jul 2026 | £395,000 |
| 21 Aug 2017 | £360,000 |
No other historical records.
Flat 27, 1b Ment House, Mentmore Terrace, Hackney, London E8 3DQ

| Today | See today's value |
| 23 Jul 2026 | £875,000 |
| 28 Nov 2011 | £399,995 |
No other historical records.
Flat 1, 303, Queensbridge Road, Hackney, London E8 3LX
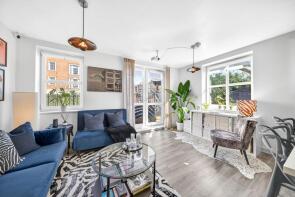
| Today | See today's value |
| 22 Jul 2026 | £525,000 |
| 14 Feb 2007 | £220,000 |
Ground Floor Flat, 90, Dalston Lane, Hackney, London E8 3AH
| Today | See today's value |
| 22 Jul 2026 | £635,000 |
| 22 Sep 2009 | £196,000 |
No other historical records.
96, Lenthall Road, Hackney, London E8 3JN

| Today | See today's value |
| 17 Jul 2026 | £1,825,000 |
| 3 Nov 2006 | £560,000 |
No other historical records.
Flat 28, Benfleet Court, Queensbridge Road, Hackney, London E8 4JJ
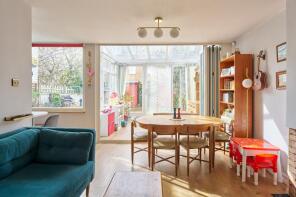
| Today | See today's value |
| 16 Jul 2026 | £735,000 |
| 18 Dec 2020 | £630,000 |


Rightmove takes no liability for your use of, or reliance on, Rightmove's Instant Valuation due to the limitations of our tracking tool listed here. Use of this tool is taken entirely at your own risk. All rights reserved.