
House Prices in Fitton Hill
House prices in Fitton Hill have an overall average of £201,350 over the last year.
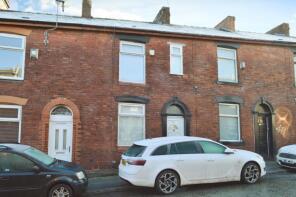
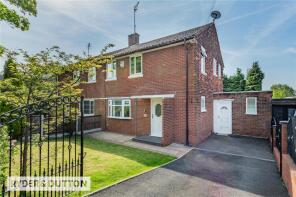
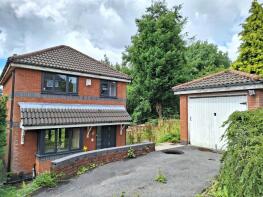
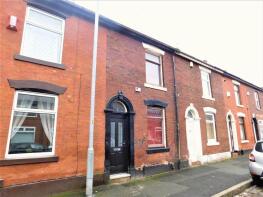
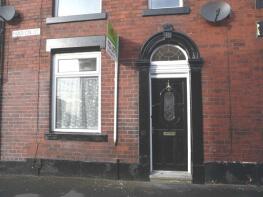
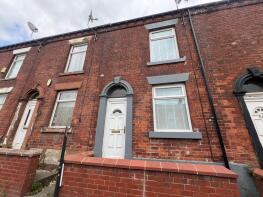
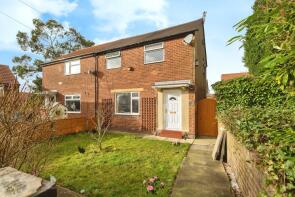
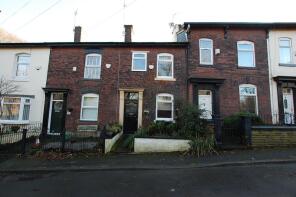
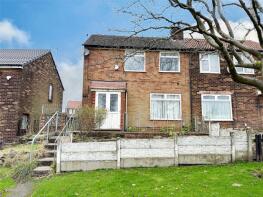
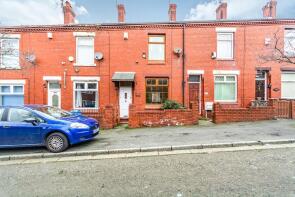
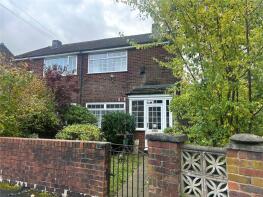
The majority of properties sold in Fitton Hill during the last year were terraced properties, selling for an average price of £143,052. Semi-detached properties sold for an average of £199,020, with detached properties fetching £285,087.
Overall, the historical sold prices in Fitton Hill over the last year were 20% up on the previous year and 39% up on the 2022 peak of £144,845.
Properties Sold
226, Honeywell Lane, Oldham OL8 2JR
| Today | See what it's worth now |
| 22 Sep 2025 | £140,000 |
| 11 Feb 2021 | £79,995 |
10, Fir Tree Avenue, Oldham OL8 2SR
| Today | See what it's worth now |
| 19 Sep 2025 | £236,000 |
| 25 Jun 2019 | £129,995 |
11, Alders Court, Oldham OL8 2UB
| Today | See what it's worth now |
| 17 Sep 2025 | £115,000 |
| 29 Jul 2016 | £57,425 |
No other historical records.
4, Ruislip Close, Oldham OL8 2JN
| Today | See what it's worth now |
| 3 Sep 2025 | £215,000 |
| 5 Jan 2007 | £142,500 |
No other historical records.
256, Belgrave Road, Oldham OL8 2JU
| Today | See what it's worth now |
| 26 Aug 2025 | £130,000 |
| 18 Oct 2024 | £130,000 |
1, Marion Street, Oldham OL8 2AW
| Today | See what it's worth now |
| 15 Aug 2025 | £110,000 |
| 24 May 2013 | £38,000 |
No other historical records.
44, Hough Close, Oldham OL8 2NZ


| Today | See what it's worth now |
| 8 Aug 2025 | £185,000 |
| 9 Nov 2001 | £36,500 |
667, Ashton Road, Oldham OL8 2RA
| Today | See what it's worth now |
| 8 Aug 2025 | £145,000 |
| 20 Sep 2019 | £82,000 |
18, Rosary Road, Oldham OL8 2SW
| Today | See what it's worth now |
| 31 Jul 2025 | £190,000 |
| 13 Oct 2023 | £160,000 |
No other historical records.
42, Keb Lane, Oldham OL8 2TY

| Today | See what it's worth now |
| 30 Jul 2025 | £200,000 |
No other historical records.
37, Moorwood Drive, Oldham OL8 2XD
| Today | See what it's worth now |
| 25 Jul 2025 | £170,000 |
| 16 Jun 2017 | £139,000 |
62, Fircroft Road, Oldham OL8 2QD
| Today | See what it's worth now |
| 18 Jul 2025 | £185,500 |
No other historical records.
32, Hilary Avenue, Oldham OL8 2TD
| Today | See what it's worth now |
| 18 Jul 2025 | £232,000 |
| 22 Aug 2014 | £104,000 |
No other historical records.
5, The Green, Oldham OL8 2LS
| Today | See what it's worth now |
| 9 Jul 2025 | £125,000 |
| 13 Jan 2015 | £48,000 |
No other historical records.
264, Honeywell Lane, Oldham OL8 2JS
| Today | See what it's worth now |
| 7 Jul 2025 | £135,000 |
| 22 Apr 1996 | £18,100 |
No other historical records.
93, Fir Tree Avenue, Oldham OL8 2QS
| Today | See what it's worth now |
| 2 Jul 2025 | £155,000 |
| 2 Sep 2011 | £63,000 |
No other historical records.
17, Kenyon Avenue, Oldham OL8 1NP
| Today | See what it's worth now |
| 23 Jun 2025 | £100,000 |
| 23 Sep 2019 | £66,000 |
7, Prior Street, Oldham OL8 2DF
| Today | See what it's worth now |
| 20 Jun 2025 | £160,500 |
| 31 Oct 2016 | £80,000 |
No other historical records.
25, Lovage Drive, Oldham OL8 2EU

| Today | See what it's worth now |
| 20 Jun 2025 | £284,995 |
No other historical records.
12, Kingsbridge Road, Oldham OL8 2BT

| Today | See what it's worth now |
| 12 Jun 2025 | £95,000 |
| 8 Oct 2024 | £80,000 |
270, Belgrave Road, Oldham OL8 2JU

| Today | See what it's worth now |
| 11 Jun 2025 | £100,000 |
| 30 Mar 2015 | £38,000 |
6, Hough Close, Oldham OL8 2NZ
| Today | See what it's worth now |
| 9 Jun 2025 | £190,000 |
| 21 Jun 1996 | £36,950 |
No other historical records.
34, Titchfield Road, Oldham OL8 2DW
| Today | See what it's worth now |
| 29 May 2025 | £200,000 |
| 31 Jan 2022 | £180,000 |
21, Titchfield Road, Oldham OL8 2DW
| Today | See what it's worth now |
| 28 May 2025 | £160,000 |
| 27 Sep 2019 | £93,000 |
98, Fir Tree Avenue, Oldham OL8 2PL
| Today | See what it's worth now |
| 22 May 2025 | £120,000 |
No other historical records.
Get ready with a Mortgage in Principle
- Personalised result in just 20 minutes
- Find out how much you can borrow
- Get viewings faster with agents
- No impact on your credit score
What's your property worth?
Source Acknowledgement: © Crown copyright. England and Wales house price data is publicly available information produced by the HM Land Registry.This material was last updated on 20 November 2025. It covers the period from 1 January 1995 to 30 September 2025 and contains property transactions which have been registered during that period. Contains HM Land Registry data © Crown copyright and database right 2025. This data is licensed under the Open Government Licence v3.0.
Disclaimer: Rightmove.co.uk provides this HM Land Registry data "as is". The burden for fitness of the data relies completely with the user and is provided for informational purposes only. No warranty, express or implied, is given relating to the accuracy of content of the HM Land Registry data and Rightmove does not accept any liability for error or omission. If you have found an error with the data or need further information please contact HM Land Registry.
Permitted Use: Viewers of this Information are granted permission to access this Crown copyright material and to download it onto electronic, magnetic, optical or similar storage media provided that such activities are for private research, study or in-house use only. Any other use of the material requires the formal written permission of Land Registry which can be requested from us, and is subject to an additional licence and associated charge.
Map data ©OpenStreetMap contributors.
Rightmove takes no liability for your use of, or reliance on, Rightmove's Instant Valuation due to the limitations of our tracking tool listed here. Use of this tool is taken entirely at your own risk. All rights reserved.