
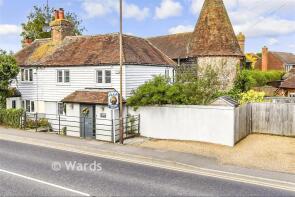
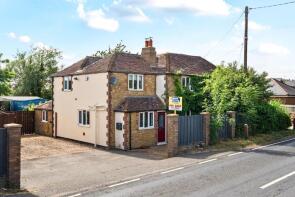
House Prices in Headcorn
House prices in Headcorn have an overall average of £473,402 over the last year.
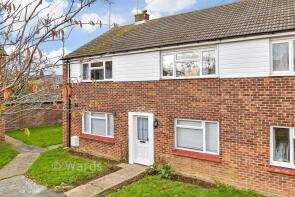
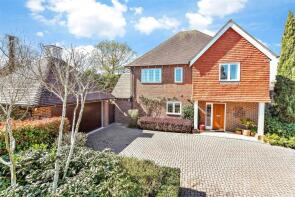
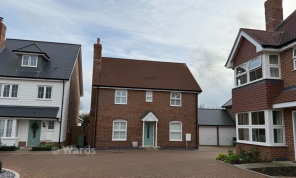
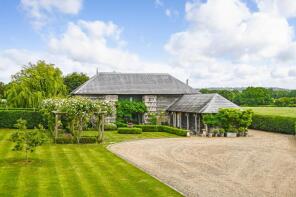
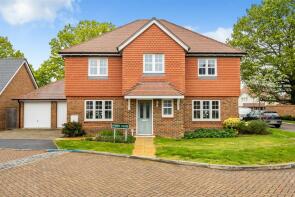
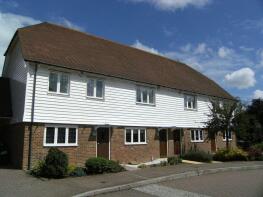
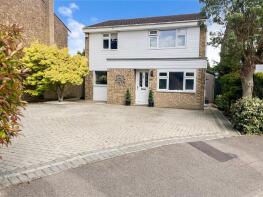
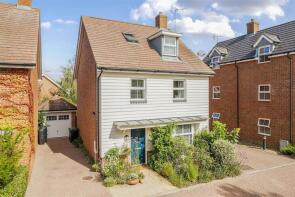
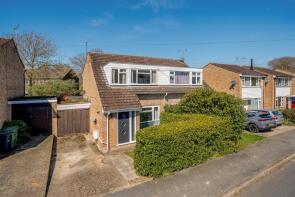
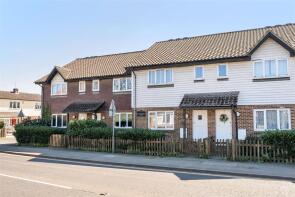
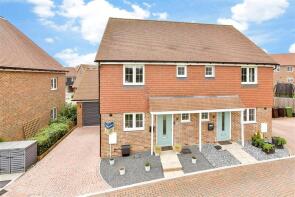
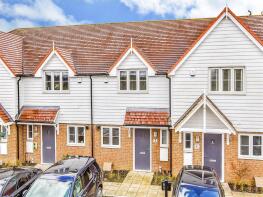
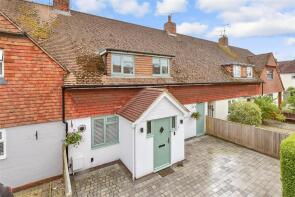
The majority of properties sold in Headcorn during the last year were detached properties, selling for an average price of £619,300. Semi-detached properties sold for an average of £367,818, with terraced properties fetching £322,278.
Overall, the historical sold prices in Headcorn over the last year were 9% up on the previous year and 3% up on the 2023 peak of £459,764.
Properties Sold
Lily Cottage, Ulcombe Road, Ashford TN27 9QR

| Today | See what it's worth now |
| 13 Apr 2026 | £415,000 |
| 12 Sep 2013 | £290,000 |
No other historical records.
19, Knights Way, Ashford TN27 9TX
| Today | See what it's worth now |
| 27 Mar 2026 | £200,000 |
| 14 Mar 2025 | £162,000 |
25, The Chantry, Ashford TN27 9TF
| Today | See what it's worth now |
| 24 Mar 2026 | £700,000 |
| 4 Nov 2005 | £452,000 |
No other historical records.
6, Juniper Court, Ashford TN27 9FX
| Today | See what it's worth now |
| 18 Mar 2026 | £560,000 |
| 27 May 2022 | £540,000 |
No other historical records.
Glovers Bridge Barn, Grigg Lane, Headcorn TN27 9LS
| Today | See what it's worth now |
| 20 Feb 2026 | £1,100,000 |
No other historical records.
78, Knaves Acre, Ashford TN27 9TJ
| Today | See what it's worth now |
| 20 Feb 2026 | £423,300 |
| 19 Jun 2017 | £375,000 |
4, Providence Place, Stonestile Road, Ashford TN27 9PG
| Today | See what it's worth now |
| 19 Feb 2026 | £300,000 |
| 26 Jun 2006 | £215,000 |
No other historical records.
46, Chaplin Drive, Headcorn TN27 9TN
| Today | See what it's worth now |
| 6 Feb 2026 | £287,500 |
No other historical records.
26, Chaplin Drive, Headcorn TN27 9TN
| Today | See what it's worth now |
| 29 Jan 2026 | £350,000 |
No other historical records.
45, Wheeler Street, Ashford TN27 9ST
| Today | See what it's worth now |
| 16 Jan 2026 | £342,500 |
| 14 Jan 2021 | £325,000 |
1, Stone Cottages, Maidstone Road, Ashford TN27 9RR
| Today | See what it's worth now |
| 8 Jan 2026 | £355,000 |
| 21 Mar 2014 | £320,000 |
2, Reeves Road, Ashford TN27 9BS
| Today | See what it's worth now |
| 19 Dec 2025 | £440,000 |
| 8 Apr 2022 | £425,000 |
No other historical records.
2, Bobbin Close, Ashford TN27 9AW
| Today | See what it's worth now |
| 17 Dec 2025 | £680,000 |
| 30 Apr 2019 | £650,000 |
No other historical records.
14, The Chantry, Ashford TN27 9TF
| Today | See what it's worth now |
| 11 Dec 2025 | £330,000 |
| 25 Oct 2016 | £295,000 |
37, Chaplin Drive, Ashford TN27 9TN
| Today | See what it's worth now |
| 10 Dec 2025 | £475,000 |
| 3 Feb 2015 | £320,000 |
14, Culpeper Court, North Street, Ashford TN27 9NN

| Today | See what it's worth now |
| 24 Nov 2025 | £240,000 |
| 11 Oct 2024 | £240,000 |
9, Locks Yard, Ashford TN27 9AD
| Today | See what it's worth now |
| 7 Nov 2025 | £495,000 |
| 3 Mar 2017 | £422,000 |
51, Bankfields, Ashford TN27 9QY

| Today | See what it's worth now |
| 7 Nov 2025 | £307,000 |
| 21 Nov 2012 | £185,000 |
No other historical records.
27, Knaves Acre, Ashford TN27 9TJ
| Today | See what it's worth now |
| 7 Nov 2025 | £360,000 |
| 3 May 2022 | £330,000 |
23, Sharps Field, Ashford TN27 9UF

| Today | See what it's worth now |
| 7 Nov 2025 | £412,500 |
| 19 Jun 2013 | £265,000 |
8, Black Horse Court, Wheeler Street, Ashford TN27 9ST
| Today | See what it's worth now |
| 4 Nov 2025 | £164,500 |
| 17 Mar 2015 | £117,500 |
4, The Cloth Hall, North Street, Headcorn TN27 9NN
| Today | See what it's worth now |
| 3 Nov 2025 | £251,000 |
No other historical records.
41, Silver Birch Road, Ashford TN27 9FA
| Today | See what it's worth now |
| 1 Nov 2025 | £395,000 |
| 27 Nov 2020 | £365,000 |
No other historical records.
Source Acknowledgement: © Crown copyright. England and Wales house price data is publicly available information produced by the HM Land Registry.This material was last updated on 9 July 2026. It covers the period from 1 January 1995 to 30 April 2026 and contains property transactions which have been registered during that period. Contains HM Land Registry data © Crown copyright and database right 2026. This data is licensed under the Open Government Licence v3.0.
Disclaimer: Rightmove.co.uk provides this HM Land Registry data "as is". The burden for fitness of the data relies completely with the user and is provided for informational purposes only. No warranty, express or implied, is given relating to the accuracy of content of the HM Land Registry data and Rightmove does not accept any liability for error or omission. If you have found an error with the data or need further information please contact HM Land Registry.
Permitted Use: Viewers of this Information are granted permission to access this Crown copyright material and to download it onto electronic, magnetic, optical or similar storage media provided that such activities are for private research, study or in-house use only. Any other use of the material requires the formal written permission of Land Registry which can be requested from us, and is subject to an additional licence and associated charge.
Rightmove takes no liability for your use of, or reliance on, Rightmove's Instant Valuation due to the limitations of our tracking tool listed here. Use of this tool is taken entirely at your own risk. All rights reserved.