
House Prices in Headingley Hill
House prices in Headingley Hill have an overall average of £215,421 over the last year.
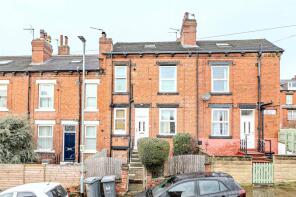
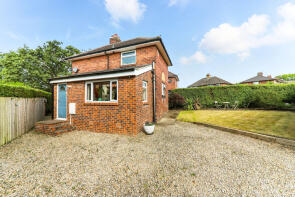
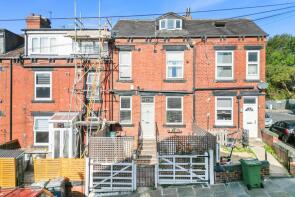
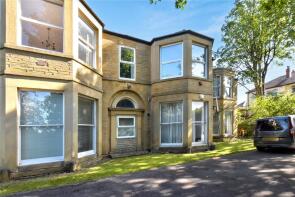
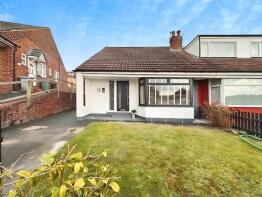
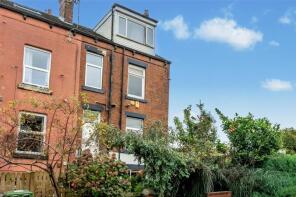
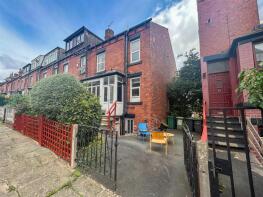
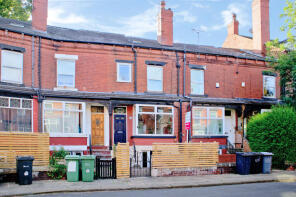
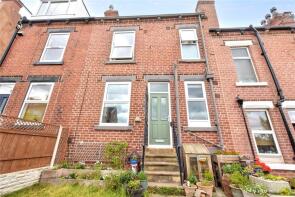
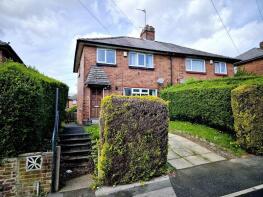
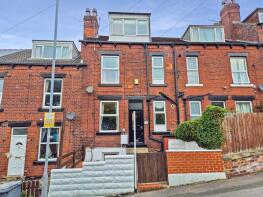
The majority of properties sold in Headingley Hill during the last year were terraced properties, selling for an average price of £205,945. Semi-detached properties sold for an average of £262,553, with flats fetching £119,000.
Overall, the historical sold prices in Headingley Hill over the last year were 2% down on the previous year and 5% up on the 2022 peak of £204,536.
Properties Sold
41, Sowood Street, Burley, Leeds LS4 2JZ
| Today | See what it's worth now |
| 16 Apr 2026 | £206,800 |
| 27 Oct 2017 | £132,000 |
15, Stanmore Grove, Burley, Leeds LS4 2RJ
| Today | See what it's worth now |
| 1 Apr 2026 | £280,500 |
| 28 Jun 2018 | £184,500 |
69, Bankfield Terrace, Burley, Leeds LS4 2JR
| Today | See what it's worth now |
| 25 Mar 2026 | £210,000 |
| 2 Sep 2021 | £181,605 |
Flat 3, 81 St Anns Hill, St Anns Lane, Burley, Leeds LS4 2SG
| Today | See what it's worth now |
| 23 Mar 2026 | £103,000 |
| 26 Oct 2018 | £170,000 |
17, Bankfield Grove, Burley, Leeds LS4 2SS
| Today | See what it's worth now |
| 20 Mar 2026 | £253,000 |
| 22 Dec 2009 | £158,000 |
4, Elsham Terrace, Burley, Leeds LS4 2RB

| Today | See what it's worth now |
| 16 Mar 2026 | £201,500 |
| 8 Dec 2006 | £138,950 |
103, Burley Wood Crescent, Burley, Leeds LS4 2QJ
| Today | See what it's worth now |
| 6 Mar 2026 | £230,000 |
| 3 Nov 2022 | £190,000 |
36, Elsham Terrace, Burley, Leeds LS4 2RB
| Today | See what it's worth now |
| 5 Mar 2026 | £180,000 |
| 22 Aug 2005 | £110,000 |
2, St Matthias Terrace, Burley, Leeds LS4 2EA
| Today | See what it's worth now |
| 2 Mar 2026 | £188,000 |
| 5 Oct 2018 | £145,000 |
No other historical records.
11, Woodside Avenue, Burley, Leeds LS4 2QX
| Today | See what it's worth now |
| 23 Feb 2026 | £222,000 |
| 21 Jan 2021 | £185,000 |
10, Eden Gardens, Burley, Leeds LS4 2TQ
| Today | See what it's worth now |
| 20 Feb 2026 | £260,000 |
| 30 Sep 2021 | £180,000 |
No other historical records.
153, Burley Wood Crescent, Burley, Leeds LS4 2QJ

| Today | See what it's worth now |
| 12 Feb 2026 | £237,000 |
| 26 Jul 2019 | £165,000 |
9, Lumley Place, Burley, Leeds LS4 2NL
| Today | See what it's worth now |
| 4 Feb 2026 | £226,500 |
| 25 May 2007 | £145,000 |
51, Beechwood Mount, Burley, Leeds LS4 2NQ
| Today | See what it's worth now |
| 30 Jan 2026 | £214,000 |
| 6 Jul 2015 | £130,000 |
55, Beechwood View, Burley, Leeds LS4 2LP
| Today | See what it's worth now |
| 16 Jan 2026 | £236,500 |
| 2 Nov 2018 | £170,000 |
36, Knowle Terrace, Burley, Leeds LS4 2PA
| Today | See what it's worth now |
| 13 Jan 2026 | £130,000 |
No other historical records.
30, Argie Road, Burley, Leeds LS4 2RD
| Today | See what it's worth now |
| 9 Jan 2026 | £190,000 |
| 3 Mar 2006 | £120,000 |
7, Stanmore Grove, Burley, Leeds LS4 2RJ
| Today | See what it's worth now |
| 9 Jan 2026 | £245,000 |
| 12 Aug 2002 | £91,795 |
No other historical records.
45, Stanmore Crescent, Burley, Leeds LS4 2RY

| Today | See what it's worth now |
| 18 Dec 2025 | £328,000 |
| 14 Oct 2022 | £330,000 |
19, Barnbrough Street, Burley, Leeds LS4 2QY
| Today | See what it's worth now |
| 17 Dec 2025 | £214,650 |
| 12 Feb 2010 | £128,000 |
15, Sowood Street, Burley, Leeds LS4 2JZ
| Today | See what it's worth now |
| 17 Dec 2025 | £230,000 |
No other historical records.
136, Kirkstall Hill, Burley, Leeds LS4 2SX
| Today | See what it's worth now |
| 17 Dec 2025 | £250,000 |
| 12 Apr 2002 | £110,000 |
16, Talbot View, Burley, Leeds LS4 2RQ
| Today | See what it's worth now |
| 12 Dec 2025 | £212,000 |
| 27 Jun 2017 | £155,000 |
Source Acknowledgement: © Crown copyright. England and Wales house price data is publicly available information produced by the HM Land Registry.This material was last updated on 9 July 2026. It covers the period from 1 January 1995 to 30 April 2026 and contains property transactions which have been registered during that period. Contains HM Land Registry data © Crown copyright and database right 2026. This data is licensed under the Open Government Licence v3.0.
Disclaimer: Rightmove.co.uk provides this HM Land Registry data "as is". The burden for fitness of the data relies completely with the user and is provided for informational purposes only. No warranty, express or implied, is given relating to the accuracy of content of the HM Land Registry data and Rightmove does not accept any liability for error or omission. If you have found an error with the data or need further information please contact HM Land Registry.
Permitted Use: Viewers of this Information are granted permission to access this Crown copyright material and to download it onto electronic, magnetic, optical or similar storage media provided that such activities are for private research, study or in-house use only. Any other use of the material requires the formal written permission of Land Registry which can be requested from us, and is subject to an additional licence and associated charge.
Rightmove takes no liability for your use of, or reliance on, Rightmove's Instant Valuation due to the limitations of our tracking tool listed here. Use of this tool is taken entirely at your own risk. All rights reserved.