
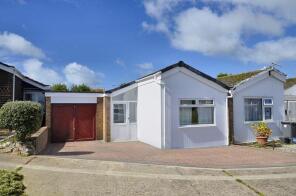
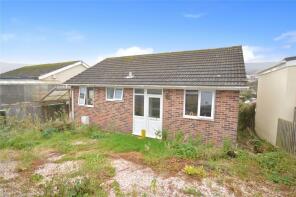
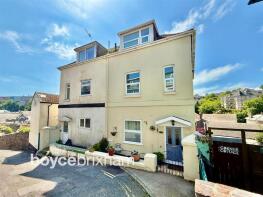
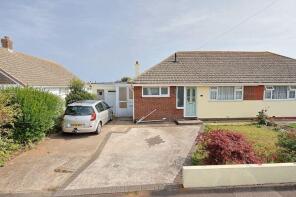
House Prices in Higher Brixham
House prices in Higher Brixham have an overall average of £268,990 over the last year.
The majority of properties sold in Higher Brixham during the last year were detached properties, selling for an average price of £343,094. Terraced properties sold for an average of £238,107, with semi-detached properties fetching £295,000.
Overall, the historical sold prices in Higher Brixham over the last year were 6% down on the previous year and 13% down on the 2022 peak of £307,665.
Properties Sold
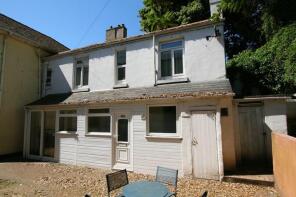
101a, New Road, Brixham TQ5 8BY
| Today | See what it's worth now |
| 24 Apr 2026 | £260,000 |
| 17 Dec 2021 | £217,500 |
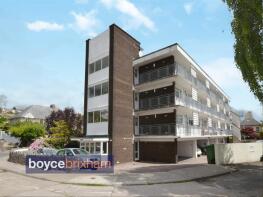
Flat 9, Brimlands Court, New Road, Brixham TQ5 8DP
| Today | See what it's worth now |
| 17 Apr 2026 | £127,000 |
| 10 Jul 2015 | £115,000 |
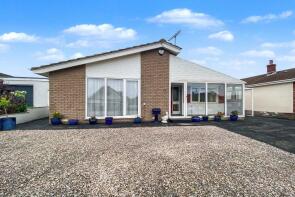
41, Lichfield Drive, Brixham TQ5 8DH
| Today | See what it's worth now |
| 16 Apr 2026 | £335,000 |
| 10 Dec 2021 | £370,000 |
No other historical records.
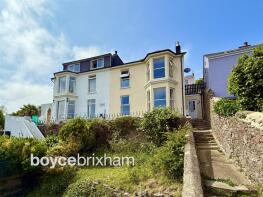
5, Alma Road, Brixham TQ5 8QR

| Today | See what it's worth now |
| 8 Apr 2026 | £300,000 |
| 21 Mar 2022 | £305,000 |
19, Church Street, Brixham TQ5 8HG
| Today | See what it's worth now |
| 1 Apr 2026 | £290,000 |
| 29 Mar 2021 | £262,000 |
No other historical records.
4, Elliott Grove, Brixham TQ5 8RT
| Today | See what it's worth now |
| 6 Mar 2026 | £210,000 |
| 24 Feb 2017 | £162,500 |
No other historical records.
Flat 4, Priors Court, New Road, Brixham TQ5 8NE
| Today | See what it's worth now |
| 3 Mar 2026 | £115,000 |
| 6 Aug 2004 | £99,500 |
36, Cumber Drive, Brixham TQ5 8RW
| Today | See what it's worth now |
| 26 Feb 2026 | £225,000 |
| 4 Nov 2005 | £129,300 |
No other historical records.
Flat 7, Priors Court, New Road, Brixham TQ5 8NE
| Today | See what it's worth now |
| 19 Feb 2026 | £110,000 |
| 13 Sep 2017 | £88,500 |
52, Cumber Drive, Brixham TQ5 8RW
| Today | See what it's worth now |
| 13 Feb 2026 | £235,000 |
| 22 Aug 2014 | £159,500 |
14, Elliott Grove, Brixham TQ5 8RT
| Today | See what it's worth now |
| 12 Feb 2026 | £236,000 |
| 26 Jul 1996 | £47,000 |
No other historical records.
10, Church Hill West, Brixham TQ5 8EY
| Today | See what it's worth now |
| 2 Feb 2026 | £195,000 |
| 7 Aug 2017 | £137,500 |
3, Gollands Close, Brixham TQ5 8JZ
| Today | See what it's worth now |
| 30 Jan 2026 | £272,500 |
| 2 Sep 2020 | £287,500 |
2, Richmond House, Higher Manor Road, Brixham TQ5 8HA
| Today | See what it's worth now |
| 30 Jan 2026 | £190,000 |
| 30 Oct 2013 | £105,000 |
51, North Hill Close, Brixham TQ5 8RY
| Today | See what it's worth now |
| 30 Jan 2026 | £152,500 |
| 29 Jun 2001 | £54,000 |
First Floor Flat 2, 81, South Furzeham Road, Brixham TQ5 8JF
| Today | See what it's worth now |
| 15 Dec 2025 | £275,000 |
| 25 Mar 2022 | £220,000 |
No other historical records.
3, Meadow Park, Brixham TQ5 8NX
| Today | See what it's worth now |
| 12 Dec 2025 | £230,000 |
| 20 Jan 2014 | £195,000 |
24, Pillar Avenue, Brixham TQ5 8LB
| Today | See what it's worth now |
| 5 Dec 2025 | £265,000 |
| 12 May 2000 | £68,000 |
No other historical records.
3, North Hill Close, Brixham TQ5 8RX
| Today | See what it's worth now |
| 5 Dec 2025 | £270,000 |
| 31 Oct 2012 | £154,000 |
14, Lichfield Drive, Brixham TQ5 8DN
| Today | See what it's worth now |
| 5 Dec 2025 | £355,000 |
| 31 Jan 2018 | £338,000 |
5, Heather Way, Brixham TQ5 8LR

| Today | See what it's worth now |
| 28 Nov 2025 | £337,500 |
| 26 May 2015 | £185,000 |
No other historical records.
42, Higher Street, Brixham TQ5 8HW
| Today | See what it's worth now |
| 27 Nov 2025 | £105,000 |
| 12 Apr 2013 | £112,000 |
63, Cumber Drive, Brixham TQ5 8RW
| Today | See what it's worth now |
| 20 Nov 2025 | £200,000 |
| 19 Feb 2015 | £136,000 |
Source Acknowledgement: © Crown copyright. England and Wales house price data is publicly available information produced by the HM Land Registry.This material was last updated on 9 July 2026. It covers the period from 1 January 1995 to 30 April 2026 and contains property transactions which have been registered during that period. Contains HM Land Registry data © Crown copyright and database right 2026. This data is licensed under the Open Government Licence v3.0.
Disclaimer: Rightmove.co.uk provides this HM Land Registry data "as is". The burden for fitness of the data relies completely with the user and is provided for informational purposes only. No warranty, express or implied, is given relating to the accuracy of content of the HM Land Registry data and Rightmove does not accept any liability for error or omission. If you have found an error with the data or need further information please contact HM Land Registry.
Permitted Use: Viewers of this Information are granted permission to access this Crown copyright material and to download it onto electronic, magnetic, optical or similar storage media provided that such activities are for private research, study or in-house use only. Any other use of the material requires the formal written permission of Land Registry which can be requested from us, and is subject to an additional licence and associated charge.
Rightmove takes no liability for your use of, or reliance on, Rightmove's Instant Valuation due to the limitations of our tracking tool listed here. Use of this tool is taken entirely at your own risk. All rights reserved.