
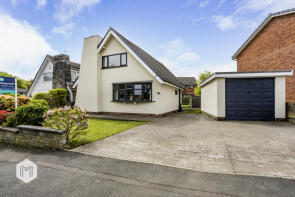
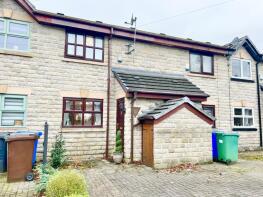
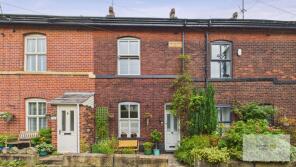
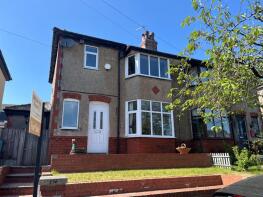
House Prices in Holcombe Brook
House prices in Holcombe Brook have an overall average of £350,906 over the last year.
The majority of properties sold in Holcombe Brook during the last year were semi-detached properties, selling for an average price of £298,250. Detached properties sold for an average of £490,286, with terraced properties fetching £266,421.
Overall, the historical sold prices in Holcombe Brook over the last year were similar to the previous year and 2% down on the 2022 peak of £359,652.
Properties Sold
164, Summerseat Lane, Bury BL0 9TT
| Today | See what it's worth now |
| 17 Apr 2026 | £380,000 |
| 20 Oct 2006 | £249,950 |
No other historical records.
24, Cemetery Road, Bury BL0 9PU
| Today | See what it's worth now |
| 27 Mar 2026 | £250,000 |
| 23 Sep 2005 | £129,950 |
22, Stretton Road, Bury BL0 9SX

| Today | See what it's worth now |
| 20 Mar 2026 | £340,000 |
| 15 Apr 2024 | £213,750 |
17, Pot Green, Bury BL0 9RG
| Today | See what it's worth now |
| 9 Mar 2026 | £265,000 |
| 29 Jul 2022 | £225,000 |
356, Bolton Road West, Bury BL0 9QY
| Today | See what it's worth now |
| 5 Mar 2026 | £200,000 |
| 16 Dec 2011 | £114,950 |
No other historical records.
29, Holcombe Lee, Bury BL0 9QR
| Today | See what it's worth now |
| 5 Mar 2026 | £267,000 |
| 29 May 2018 | £162,000 |
No other historical records.
306, Bolton Road West, Bury BL0 9QF

| Today | See what it's worth now |
| 20 Feb 2026 | £290,000 |
| 8 Jun 2012 | £216,000 |
23, Lancaster Avenue, Ramsbottom BL0 9QA
| Today | See what it's worth now |
| 9 Feb 2026 | £202,000 |
No other historical records.
56, Hazel Hall Lane, Bury BL0 9UP

| Today | See what it's worth now |
| 30 Jan 2026 | £235,000 |
| 21 Nov 2011 | £117,000 |
40a, Longsight Road, Bury BL0 9SN
| Today | See what it's worth now |
| 18 Dec 2025 | £430,000 |
| 5 Jun 2020 | £362,000 |
9, Mayfield Close, Bury BL0 9TL
| Today | See what it's worth now |
| 15 Dec 2025 | £694,000 |
| 7 May 2010 | £337,500 |
314, Bolton Road West, Bury BL0 9QF

| Today | See what it's worth now |
| 15 Dec 2025 | £165,000 |
| 6 Feb 2008 | £100,000 |
No other historical records.
2, Stretton Road, Bury BL0 9SX

| Today | See what it's worth now |
| 28 Nov 2025 | £368,000 |
| 2 Apr 1997 | £73,950 |
No other historical records.
6, Harcles Drive, Ramsbottom BL0 9UE
| Today | See what it's worth now |
| 24 Nov 2025 | £258,000 |
No other historical records.
11, Brooklands Road, Bury BL0 9SW
| Today | See what it's worth now |
| 7 Nov 2025 | £470,000 |
| 17 Jan 2014 | £250,000 |
No other historical records.
253, Bolton Road West, Bury BL0 9PS
| Today | See what it's worth now |
| 6 Nov 2025 | £270,000 |
| 27 Oct 2020 | £193,500 |
31, Longsight Road, Bury BL0 9SL
| Today | See what it's worth now |
| 3 Nov 2025 | £720,000 |
| 3 Nov 2025 | £720,000 |
6, Coleridge Road, Bury BL8 4EW

| Today | See what it's worth now |
| 3 Nov 2025 | £430,000 |
| 15 Jun 2020 | £382,500 |
108, Summerseat Lane, Bury BL0 9TP

| Today | See what it's worth now |
| 31 Oct 2025 | £600,000 |
| 3 Apr 1995 | £147,950 |
No other historical records.
1, Lumb Carr Avenue, Bury BL0 9QG

| Today | See what it's worth now |
| 30 Oct 2025 | £325,000 |
| 10 Dec 2021 | £310,000 |
Apartment 50, 18 Valley Court, Longsight Road, Bury BL0 9FY
| Today | See what it's worth now |
| 29 Oct 2025 | £185,000 |
| 30 Sep 2017 | £174,999 |
No other historical records.
18, Stretton Road, Bury BL0 9SX
| Today | See what it's worth now |
| 28 Oct 2025 | £380,000 |
| 21 Nov 2003 | £160,000 |
Apartment 11, 18 Valley Court, Longsight Road, Bury BL0 9FY
| Today | See what it's worth now |
| 28 Oct 2025 | £210,000 |
| 16 Dec 2016 | £169,999 |
No other historical records.
Source Acknowledgement: © Crown copyright. England and Wales house price data is publicly available information produced by the HM Land Registry.This material was last updated on 9 July 2026. It covers the period from 1 January 1995 to 30 April 2026 and contains property transactions which have been registered during that period. Contains HM Land Registry data © Crown copyright and database right 2026. This data is licensed under the Open Government Licence v3.0.
Disclaimer: Rightmove.co.uk provides this HM Land Registry data "as is". The burden for fitness of the data relies completely with the user and is provided for informational purposes only. No warranty, express or implied, is given relating to the accuracy of content of the HM Land Registry data and Rightmove does not accept any liability for error or omission. If you have found an error with the data or need further information please contact HM Land Registry.
Permitted Use: Viewers of this Information are granted permission to access this Crown copyright material and to download it onto electronic, magnetic, optical or similar storage media provided that such activities are for private research, study or in-house use only. Any other use of the material requires the formal written permission of Land Registry which can be requested from us, and is subject to an additional licence and associated charge.
Rightmove takes no liability for your use of, or reliance on, Rightmove's Instant Valuation due to the limitations of our tracking tool listed here. Use of this tool is taken entirely at your own risk. All rights reserved.