
House Prices in Holcombe
House prices in Holcombe have an overall average of £349,333 over the last year.
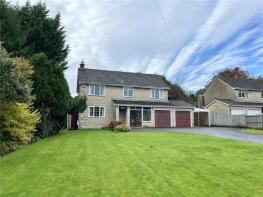
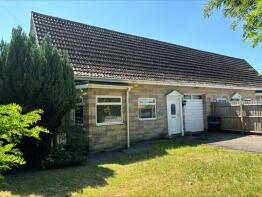
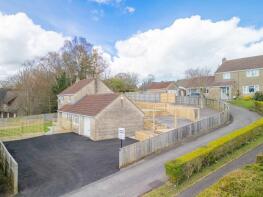
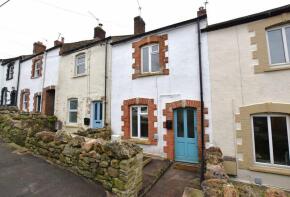
The majority of properties sold in Holcombe during the last year were detached properties, selling for an average price of £408,667. Semi-detached properties sold for an average of £240,000, with terraced properties fetching £212,000.
Overall, the historical sold prices in Holcombe over the last year were 19% down on the previous year and 24% down on the 2021 peak of £458,381.
Properties Sold
Spring Cottage, Common Lane, Holcombe, Radstock BA3 5DS
| Today | See what it's worth now |
| 18 Mar 2026 | £395,000 |
| 7 Nov 2017 | £270,000 |
Lynden House, Common Lane, Holcombe, Shepton Mallet BA3 5QB
| Today | See what it's worth now |
| 25 Feb 2026 | £280,000 |
| 15 Jul 2005 | £215,000 |
No other historical records.
Beacon View, Common Lane, Holcombe, Radstock BA3 5DP
| Today | See what it's worth now |
| 2 Dec 2025 | £310,000 |
| 20 Mar 2015 | £158,100 |
10, Kingsmead Close, Holcombe, Shepton Mallet BA3 5DR
| Today | See what it's worth now |
| 17 Nov 2025 | £405,000 |
No other historical records.
The Hayes, Silver Street, Holcombe, Shepton Mallet BA3 5EP
| Today | See what it's worth now |
| 2 Sep 2025 | £490,000 |
No other historical records.
Taormina, Silver Street, Holcombe, Radstock BA3 5EP
| Today | See what it's worth now |
| 29 Aug 2025 | £572,000 |
| 19 Dec 2001 | £220,000 |
2, Gladstone Cottages, Edford Green, Holcombe, Radstock BA3 5DB
| Today | See what it's worth now |
| 31 Jul 2025 | £240,000 |
| 23 Feb 2018 | £170,000 |
6, Tyning Cottages, Holcombe Hill, Holcombe, Radstock BA3 5DJ
| Today | See what it's worth now |
| 25 Jul 2025 | £212,000 |
| 25 Jun 2020 | £172,500 |
Skyline, Longleat Lane, Holcombe, Shepton Mallet BA3 5DQ
| Today | See what it's worth now |
| 17 Jul 2025 | £240,000 |
No other historical records.
Bay Tree Cottage, Common Lane, Holcombe, Radstock BA3 5DP
| Today | See what it's worth now |
| 29 May 2025 | £900,000 |
| 14 Sep 2015 | £585,000 |
No other historical records.
Prospect House, Longleat Lane, Holcombe, Radstock BA3 5DU
| Today | See what it's worth now |
| 18 Mar 2025 | £600,000 |
| 12 May 2016 | £375,000 |
Prospect Cottage, Longleat Lane, Holcombe, Shepton Mallet BA3 5DU
| Today | See what it's worth now |
| 7 Feb 2025 | £165,000 |
No other historical records.
8, Boundary Close, Holcombe, Radstock BA3 5FP

| Today | See what it's worth now |
| 29 Jan 2025 | £539,500 |
| 20 Nov 2014 | £280,000 |
Fernleigh, Holcombe Hill, Holcombe, Shepton Mallet BA3 5DD
| Today | See what it's worth now |
| 18 Dec 2024 | £562,500 |
No other historical records.
San Souci, Stratton Road, Holcombe, Radstock BA3 5ED
| Today | See what it's worth now |
| 19 Nov 2024 | £320,000 |
| 1 Aug 1997 | £69,500 |
4, The Mead, Brewery Lane, Holcombe, Radstock BA3 5EG

| Today | See what it's worth now |
| 16 Aug 2024 | £415,000 |
| 5 Mar 2021 | £375,000 |
7, Top Wood, Holcombe, Radstock BA3 5EZ
| Today | See what it's worth now |
| 31 Jul 2024 | £497,000 |
| 30 May 2018 | £415,000 |
11, Longleat Road, Holcombe, Radstock BA3 5DY

| Today | See what it's worth now |
| 26 Jul 2024 | £248,000 |
| 28 Feb 2019 | £184,000 |
No other historical records.
4, Mendip Gardens, Holcombe, Radstock BA3 5GB

| Today | See what it's worth now |
| 23 Jul 2024 | £575,000 |
| 13 Sep 2013 | £410,000 |
No other historical records.
1, Dunstone Cottages, Brewery Lane, Holcombe, Radstock BA3 5EH

| Today | See what it's worth now |
| 28 Jun 2024 | £590,000 |
| 7 Oct 1997 | £95,000 |
No other historical records.
Breezi Brow, Longleat Lane, Holcombe, Shepton Mallet BA3 5DZ

| Today | See what it's worth now |
| 21 Jun 2024 | £410,000 |
No other historical records.
2, Tyning Cottages, Holcombe Hill, Holcombe, Radstock BA3 5DJ

| Today | See what it's worth now |
| 20 Jun 2024 | £225,000 |
| 25 Aug 2020 | £185,500 |
14, Longleat Road, Holcombe, Shepton Mallet BA3 5DY

| Today | See what it's worth now |
| 20 Jun 2024 | £223,000 |
No other historical records.
Source Acknowledgement: © Crown copyright. England and Wales house price data is publicly available information produced by the HM Land Registry.This material was last updated on 9 July 2026. It covers the period from 1 January 1995 to 30 April 2026 and contains property transactions which have been registered during that period. Contains HM Land Registry data © Crown copyright and database right 2026. This data is licensed under the Open Government Licence v3.0.
Disclaimer: Rightmove.co.uk provides this HM Land Registry data "as is". The burden for fitness of the data relies completely with the user and is provided for informational purposes only. No warranty, express or implied, is given relating to the accuracy of content of the HM Land Registry data and Rightmove does not accept any liability for error or omission. If you have found an error with the data or need further information please contact HM Land Registry.
Permitted Use: Viewers of this Information are granted permission to access this Crown copyright material and to download it onto electronic, magnetic, optical or similar storage media provided that such activities are for private research, study or in-house use only. Any other use of the material requires the formal written permission of Land Registry which can be requested from us, and is subject to an additional licence and associated charge.
Rightmove takes no liability for your use of, or reliance on, Rightmove's Instant Valuation due to the limitations of our tracking tool listed here. Use of this tool is taken entirely at your own risk. All rights reserved.