
House Prices in LL65
House prices in LL65 have an overall average of £233,744 over the last year.
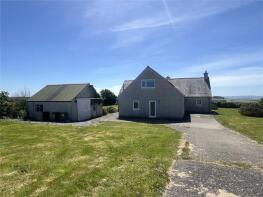
The majority of properties sold in LL65 during the last year were detached properties, selling for an average price of £357,043. Terraced properties sold for an average of £128,953, with semi-detached properties fetching £203,457.
Overall, the historical sold prices in LL65 over the last year were 7% up on the previous year and similar to the 2022 peak of £233,585.
Properties Sold
13, Ffordd Jasper, Holyhead LL65 2PF
| Today | See what it's worth now |
| 24 Apr 2026 | £117,500 |
| 14 May 1999 | £20,500 |
No other historical records.
19, Nant Y Felin, Holyhead LL65 2TQ
| Today | See what it's worth now |
| 20 Apr 2026 | £249,950 |
| 30 Apr 2002 | £116,380 |
No other historical records.
15, Roberts Street, Holyhead LL65 1SD
| Today | See what it's worth now |
| 17 Apr 2026 | £117,000 |
| 17 Jul 2002 | £43,000 |
No other historical records.
34, Stanley Avenue, Valley, Holyhead LL65 3BD
| Today | See what it's worth now |
| 17 Apr 2026 | £185,000 |
| 5 Aug 2022 | £127,000 |
No other historical records.
166, London Road, Holyhead LL65 2RB
| Today | See what it's worth now |
| 15 Apr 2026 | £188,000 |
| 21 Jun 2013 | £115,000 |
Penlon, Llanfaethlu, Holyhead LL65 4PB
| Today | See what it's worth now |
| 15 Apr 2026 | £395,000 |
| 24 Sep 2013 | £204,500 |
Allt Y Graig, Rhydwyn, Holyhead LL65 4LB
| Today | See what it's worth now |
| 15 Apr 2026 | £665,000 |
| 20 Feb 2020 | £485,000 |
No other historical records.
23, Moreton Road, Holyhead LL65 2BG
| Today | See what it's worth now |
| 13 Apr 2026 | £128,000 |
| 26 Mar 2014 | £73,000 |
24, Tara Street, Holyhead LL65 2AR
| Today | See what it's worth now |
| 9 Apr 2026 | £85,000 |
| 29 Jan 2001 | £27,000 |
No other historical records.
8, Yr Ogof, Holyhead LL65 2TN
| Today | See what it's worth now |
| 7 Apr 2026 | £335,000 |
| 3 Aug 1999 | £59,950 |
No other historical records.
23, Maes Y Mynydd, Holyhead LL65 1LP
| Today | See what it's worth now |
| 7 Apr 2026 | £112,500 |
| 18 Nov 2002 | £53,000 |
No other historical records.
23, Ffordd Feurig, Holyhead LL65 2PE
| Today | See what it's worth now |
| 31 Mar 2026 | £176,000 |
| 5 Feb 2021 | £130,500 |
11, Bro Dawel, Bodedern, Holyhead LL65 3TB
| Today | See what it's worth now |
| 31 Mar 2026 | £120,000 |
| 4 Mar 2020 | £90,000 |
No other historical records.
8, Harbour View, Holyhead LL65 2HL
| Today | See what it's worth now |
| 31 Mar 2026 | £235,000 |
| 27 May 2021 | £182,500 |
No other historical records.
9, Plashyfryd Terrace, Holyhead LL65 2AG
| Today | See what it's worth now |
| 31 Mar 2026 | £152,000 |
| 4 Mar 2022 | £135,000 |
37 Zoanle, Seabourne Road, Holyhead LL65 1AL

| Today | See what it's worth now |
| 30 Mar 2026 | £297,000 |
| 30 Apr 2004 | £148,000 |
No other historical records.
4, Windsor Villa, Llanfawr Road, Holyhead LL65 2HE
| Today | See what it's worth now |
| 27 Mar 2026 | £195,000 |
| 2 Feb 2018 | £132,000 |
Gwynlys, Salem Street, Bryngwran, Holyhead LL65 3RA
| Today | See what it's worth now |
| 17 Mar 2026 | £325,000 |
| 24 Mar 2016 | £160,000 |
No other historical records.
2, Graystones, Road From Station Road To Football Pitch, Valley, Holyhead LL65 3EW
| Today | See what it's worth now |
| 13 Mar 2026 | £232,500 |
| 19 Dec 2019 | £168,000 |
14, Holborn Road, Holyhead LL65 2AS
| Today | See what it's worth now |
| 13 Mar 2026 | £147,000 |
| 30 Jul 2001 | £44,500 |
28, Cae Rhos, Holyhead LL65 2LF

| Today | See what it's worth now |
| 13 Mar 2026 | £235,000 |
| 11 Apr 2000 | £57,000 |
No other historical records.
Bryn Ioan, Mill Road, Trearddur Bay, Holyhead LL65 2LW
| Today | See what it's worth now |
| 12 Mar 2026 | £290,500 |
| 30 Jul 1998 | £125,000 |
No other historical records.
Bethpage Hall, Old School Road, Holyhead LL65 1AQ
| Today | See what it's worth now |
| 6 Mar 2026 | £172,000 |
| 22 Oct 2020 | £140,000 |
Source Acknowledgement: © Crown copyright. England and Wales house price data is publicly available information produced by the HM Land Registry.This material was last updated on 9 July 2026. It covers the period from 1 January 1995 to 30 April 2026 and contains property transactions which have been registered during that period. Contains HM Land Registry data © Crown copyright and database right 2026. This data is licensed under the Open Government Licence v3.0.
Disclaimer: Rightmove.co.uk provides this HM Land Registry data "as is". The burden for fitness of the data relies completely with the user and is provided for informational purposes only. No warranty, express or implied, is given relating to the accuracy of content of the HM Land Registry data and Rightmove does not accept any liability for error or omission. If you have found an error with the data or need further information please contact HM Land Registry.
Permitted Use: Viewers of this Information are granted permission to access this Crown copyright material and to download it onto electronic, magnetic, optical or similar storage media provided that such activities are for private research, study or in-house use only. Any other use of the material requires the formal written permission of Land Registry which can be requested from us, and is subject to an additional licence and associated charge.
Rightmove takes no liability for your use of, or reliance on, Rightmove's Instant Valuation due to the limitations of our tracking tool listed here. Use of this tool is taken entirely at your own risk. All rights reserved.