
House Prices in M33
House prices in M33 have an overall average of £418,370 over the last year.
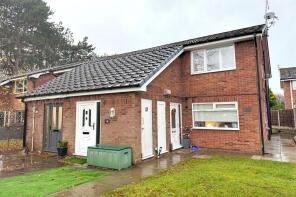
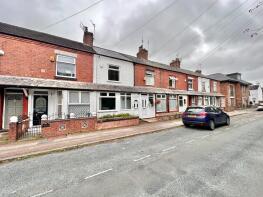
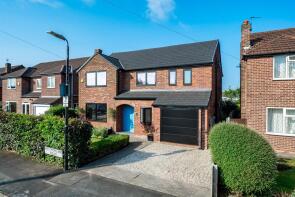
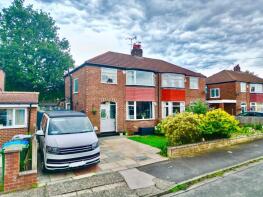
The majority of properties sold in M33 during the last year were semi-detached properties, selling for an average price of £482,427. Terraced properties sold for an average of £345,275, with flats fetching £199,536.
Overall, the historical sold prices in M33 over the last year were 3% up on the previous year and 5% up on the 2023 peak of £399,129.
Properties Sold
Barwick House, Barwick Place, Sale M33 6RB

| Today | See what it's worth now |
| 24 Apr 2026 | £535,000 |
No other historical records.
20, Windsor Court, Kilvert Drive, Sale M33 6WF
| Today | See what it's worth now |
| 17 Apr 2026 | £162,500 |
| 29 Jul 2019 | £130,000 |
18, Beechwood Drive, Sale M33 5RR
| Today | See what it's worth now |
| 10 Apr 2026 | £191,500 |
| 8 Dec 2023 | £170,000 |
Extensions and planning permission in M33
See planning approval stats, extension build costs and value added estimates.

12, Kelsall Street, Sale M33 7TF
| Today | See what it's worth now |
| 2 Apr 2026 | £325,000 |
| 26 Aug 2016 | £169,250 |
47, Westmorland Road, Sale M33 3QX
| Today | See what it's worth now |
| 2 Apr 2026 | £765,000 |
| 12 Jul 2019 | £400,000 |
No other historical records.
57, Newlyn Drive, Sale M33 3LH
| Today | See what it's worth now |
| 2 Apr 2026 | £412,500 |
| 29 Mar 2018 | £295,000 |
2, Harrow Road, Sale M33 3TL
| Today | See what it's worth now |
| 2 Apr 2026 | £900,000 |
| 5 Jan 2009 | £340,000 |
No other historical records.
1, Shrewsbury Road, Sale M33 3TW
| Today | See what it's worth now |
| 1 Apr 2026 | £608,500 |
| 12 Sep 2013 | £312,000 |
51, Russell Place, Sale M33 7LD
| Today | See what it's worth now |
| 1 Apr 2026 | £240,000 |
| 17 Dec 2003 | £179,950 |
13, Hazel Avenue, Sale M33 3DY
| Today | See what it's worth now |
| 31 Mar 2026 | £314,400 |
| 14 Jan 2022 | £265,200 |
No other historical records.
11, Stamford Street, Sale M33 6LL

| Today | See what it's worth now |
| 31 Mar 2026 | £320,000 |
| 31 Mar 2017 | £130,000 |
No other historical records.
360, Glebelands Road, Sale M33 5GQ
| Today | See what it's worth now |
| 31 Mar 2026 | £475,000 |
| 30 Aug 2002 | £129,950 |
No other historical records.
1, Leicester Road, Sale M33 7DU
| Today | See what it's worth now |
| 31 Mar 2026 | £475,000 |
| 21 Mar 2005 | £178,000 |
37, Riding Close, Sale M33 2ZP
| Today | See what it's worth now |
| 31 Mar 2026 | £159,000 |
| 18 Dec 2019 | £123,000 |
13, Clough Avenue, Sale M33 4HX
| Today | See what it's worth now |
| 27 Mar 2026 | £478,000 |
| 2 May 2014 | £249,450 |
19, Robert Street, Sale M33 2HB
| Today | See what it's worth now |
| 27 Mar 2026 | £230,000 |
| 10 Aug 2012 | £155,000 |
24, Kelsall Street, Sale M33 7TF
| Today | See what it's worth now |
| 27 Mar 2026 | £327,000 |
| 15 Jul 2022 | £245,100 |
19 Lyme House, Kilvert Drive, Sale M33 6PR
| Today | See what it's worth now |
| 27 Mar 2026 | £800,000 |
| 14 Aug 2015 | £365,200 |
No other historical records.
74, Urban Road, Sale M33 7TU
| Today | See what it's worth now |
| 27 Mar 2026 | £592,000 |
| 6 Oct 2011 | £230,000 |
Apartment 16 Worthington Apartments 2, Crossford Court, Dane Road, Sale M33 7GR
| Today | See what it's worth now |
| 26 Mar 2026 | £158,000 |
| 17 Sep 2021 | £140,000 |
No other historical records.
35, Grange Road, Sale M33 6RZ
| Today | See what it's worth now |
| 26 Mar 2026 | £380,000 |
| 4 Nov 2016 | £280,000 |
16, Old Hall Court, Old Hall Road, Sale M33 2HP
| Today | See what it's worth now |
| 26 Mar 2026 | £121,000 |
| 7 Nov 2014 | £64,000 |
No other historical records.
40, Lynn Avenue, Sale M33 7BW
| Today | See what it's worth now |
| 26 Mar 2026 | £420,000 |
| 2 Nov 2016 | £225,000 |

Source Acknowledgement: © Crown copyright. England and Wales house price data is publicly available information produced by the HM Land Registry.This material was last updated on 9 July 2026. It covers the period from 1 January 1995 to 30 April 2026 and contains property transactions which have been registered during that period. Contains HM Land Registry data © Crown copyright and database right 2026. This data is licensed under the Open Government Licence v3.0.
Disclaimer: Rightmove.co.uk provides this HM Land Registry data "as is". The burden for fitness of the data relies completely with the user and is provided for informational purposes only. No warranty, express or implied, is given relating to the accuracy of content of the HM Land Registry data and Rightmove does not accept any liability for error or omission. If you have found an error with the data or need further information please contact HM Land Registry.
Permitted Use: Viewers of this Information are granted permission to access this Crown copyright material and to download it onto electronic, magnetic, optical or similar storage media provided that such activities are for private research, study or in-house use only. Any other use of the material requires the formal written permission of Land Registry which can be requested from us, and is subject to an additional licence and associated charge.
Rightmove takes no liability for your use of, or reliance on, Rightmove's Instant Valuation due to the limitations of our tracking tool listed here. Use of this tool is taken entirely at your own risk. All rights reserved.