
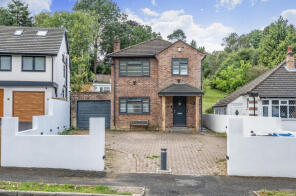
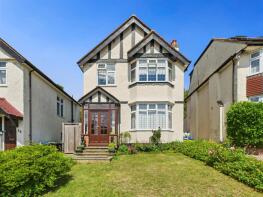
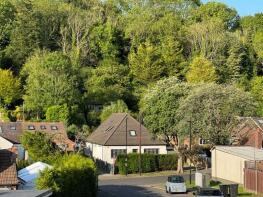
House Prices in Netherne
House prices in Netherne have an overall average of £539,139 over the last year.
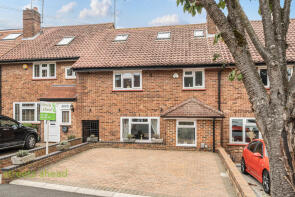
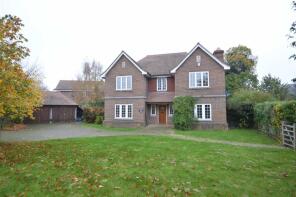
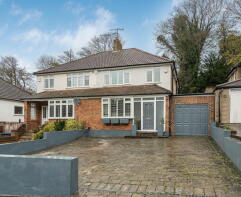
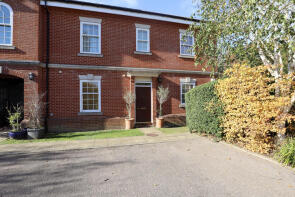
The majority of properties sold in Netherne during the last year were semi-detached properties, selling for an average price of £565,188. Detached properties sold for an average of £674,400, with terraced properties fetching £429,125.
Overall, the historical sold prices in Netherne over the last year were 2% down on the previous year and 6% down on the 2023 peak of £575,068.
Properties Sold
107, The Glade, Coulsdon CR5 1SS
| Today | See what it's worth now |
| 10 Apr 2026 | £535,000 |
| 31 Mar 2009 | £160,000 |
No other historical records.
21, Cayton Road, Coulsdon CR5 1LT
| Today | See what it's worth now |
| 10 Apr 2026 | £867,000 |
| 19 Nov 2015 | £725,000 |
95, Mead Way, Coulsdon CR5 1PQ
| Today | See what it's worth now |
| 8 Apr 2026 | £527,000 |
| 22 Jan 2010 | £250,000 |
No other historical records.
9, Wallace Square, Coulsdon CR5 1RS
| Today | See what it's worth now |
| 31 Mar 2026 | £343,000 |
| 12 Apr 2001 | £181,000 |
No other historical records.
41, Mead Way, Coulsdon CR5 1PP

| Today | See what it's worth now |
| 30 Mar 2026 | £795,000 |
| 31 Jul 2009 | £290,000 |
No other historical records.
24a, Fairdene Road, Coulsdon CR5 1RA
| Today | See what it's worth now |
| 27 Mar 2026 | £600,000 |
| 5 Oct 2007 | £408,000 |
Flat 4, Anthony House, Beckett Road, Coulsdon CR5 1LU
| Today | See what it's worth now |
| 20 Mar 2026 | £490,000 |
| 22 Dec 2004 | £340,000 |
No other historical records.
6, Thornton Crescent, Coulsdon CR5 1LH
| Today | See what it's worth now |
| 11 Mar 2026 | £530,000 |
| 3 Jul 2019 | £425,000 |
15, Reddown Road, Coulsdon CR5 1AN
| Today | See what it's worth now |
| 11 Mar 2026 | £500,000 |
No other historical records.
94a, Caterham Drive, Coulsdon CR5 1JG
| Today | See what it's worth now |
| 10 Mar 2026 | £540,000 |
| 2 Sep 2021 | £555,000 |
No other historical records.
8, Placehouse Lane, Coulsdon CR5 1LA
| Today | See what it's worth now |
| 6 Mar 2026 | £680,000 |
| 19 Mar 2018 | £478,000 |
25, Mead Way, Coulsdon CR5 1PP
| Today | See what it's worth now |
| 13 Feb 2026 | £575,000 |
No other historical records.
38 Bay Tree Cottage, Woodplace Lane, Coulsdon CR5 1NB
| Today | See what it's worth now |
| 5 Feb 2026 | £830,000 |
| 15 Jun 1999 | £167,500 |
No other historical records.
242, Chaldon Way, Coulsdon CR5 1DH
| Today | See what it's worth now |
| 30 Jan 2026 | £640,000 |
| 20 Dec 1995 | £84,000 |
No other historical records.
21, Canon's Hill, Coulsdon CR5 1HB
| Today | See what it's worth now |
| 28 Jan 2026 | £795,000 |
| 23 Jul 2014 | £610,000 |
14, Shirley Avenue, Coulsdon CR5 1QU
| Today | See what it's worth now |
| 26 Jan 2026 | £610,000 |
| 26 Nov 1999 | £263,000 |
35, Tollers Lane, Coulsdon CR5 1BF
| Today | See what it's worth now |
| 22 Jan 2026 | £632,000 |
| 21 Nov 2007 | £370,000 |
No other historical records.
155, Caterham Drive, Coulsdon CR5 1JR
| Today | See what it's worth now |
| 15 Jan 2026 | £775,000 |
| 29 Jun 2021 | £750,000 |
33, Keston Avenue, Coulsdon CR5 1HP
| Today | See what it's worth now |
| 7 Jan 2026 | £625,000 |
| 28 May 2015 | £414,000 |
No other historical records.
2, Rydons Wood Close, Coulsdon CR5 1ST
| Today | See what it's worth now |
| 7 Jan 2026 | £665,000 |
| 14 Sep 2012 | £340,000 |
No other historical records.
133, Waddington Avenue, Coulsdon CR5 1QP
| Today | See what it's worth now |
| 6 Jan 2026 | £420,000 |
| 2 Mar 2020 | £385,000 |
20, Kerrill Avenue, Coulsdon CR5 1QA
| Today | See what it's worth now |
| 19 Dec 2025 | £545,000 |
| 8 Aug 2000 | £167,500 |
No other historical records.
Flat 10, 18 Lords Wood House, Cayton Road, Coulsdon CR5 1LT

| Today | See what it's worth now |
| 19 Dec 2025 | £600,000 |
| 26 Apr 2018 | £565,000 |
Source Acknowledgement: © Crown copyright. England and Wales house price data is publicly available information produced by the HM Land Registry.This material was last updated on 9 July 2026. It covers the period from 1 January 1995 to 30 April 2026 and contains property transactions which have been registered during that period. Contains HM Land Registry data © Crown copyright and database right 2026. This data is licensed under the Open Government Licence v3.0.
Disclaimer: Rightmove.co.uk provides this HM Land Registry data "as is". The burden for fitness of the data relies completely with the user and is provided for informational purposes only. No warranty, express or implied, is given relating to the accuracy of content of the HM Land Registry data and Rightmove does not accept any liability for error or omission. If you have found an error with the data or need further information please contact HM Land Registry.
Permitted Use: Viewers of this Information are granted permission to access this Crown copyright material and to download it onto electronic, magnetic, optical or similar storage media provided that such activities are for private research, study or in-house use only. Any other use of the material requires the formal written permission of Land Registry which can be requested from us, and is subject to an additional licence and associated charge.
Rightmove takes no liability for your use of, or reliance on, Rightmove's Instant Valuation due to the limitations of our tracking tool listed here. Use of this tool is taken entirely at your own risk. All rights reserved.