
House Prices in OL7
House prices in OL7 have an overall average of £205,556 over the last year.
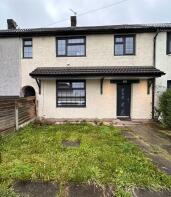
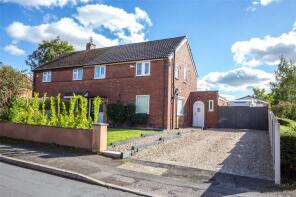
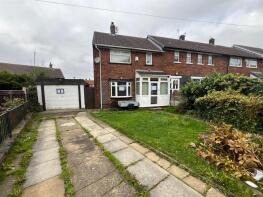
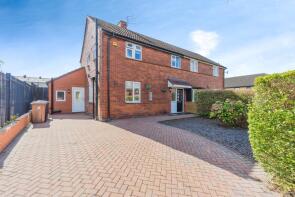
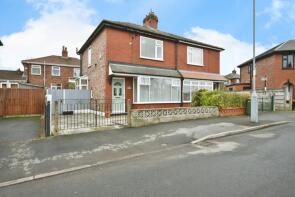
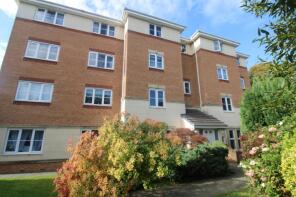
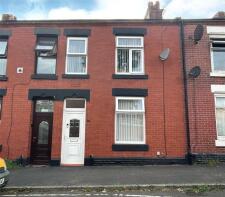
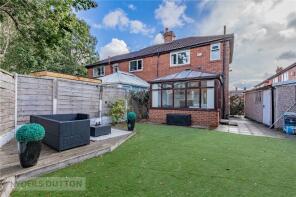
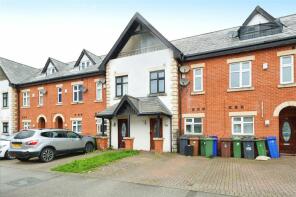
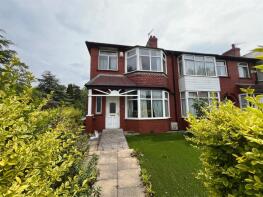
The majority of properties sold in OL7 during the last year were terraced properties, selling for an average price of £171,341. Semi-detached properties sold for an average of £236,421, with detached properties fetching £323,050.
Overall, the historical sold prices in OL7 over the last year were 3% up on the previous year and 7% up on the 2023 peak of £191,955.
Properties Sold
12, Ullswater Avenue, Ashton-under-lyne OL7 9EU
| Today | See what it's worth now |
| 22 Apr 2026 | £69,000 |
| 29 Mar 2019 | £128,000 |
9, Harmol Grove, Ashton-under-lyne OL7 9NW
| Today | See what it's worth now |
| 10 Apr 2026 | £102,000 |
| 3 Mar 2008 | £150,000 |
No other historical records.
75, Downshaw Road, Ashton-under-lyne OL7 9QL
| Today | See what it's worth now |
| 10 Apr 2026 | £135,000 |
No other historical records.
Extensions and planning permission in OL7
See planning approval stats, extension build costs and value added estimates.

15, Blucher Street, Ashton-under-lyne OL7 9NG
| Today | See what it's worth now |
| 27 Mar 2026 | £183,000 |
| 12 Apr 2019 | £131,000 |
No other historical records.
11, Oaken Clough, Ashton-under-lyne OL7 9NX
| Today | See what it's worth now |
| 13 Mar 2026 | £169,000 |
| 26 Oct 2012 | £59,000 |
8, Downshaw Road, Ashton-under-lyne OL7 9QL
| Today | See what it's worth now |
| 6 Mar 2026 | £302,500 |
| 22 Feb 2019 | £170,100 |
10, Patterdale Road, Ashton-under-lyne OL7 9JA
| Today | See what it's worth now |
| 27 Feb 2026 | £186,000 |
| 3 Oct 2007 | £100,000 |
10, Downshaw Road, Ashton-under-lyne OL7 9QL
| Today | See what it's worth now |
| 20 Feb 2026 | £272,000 |
No other historical records.
32, Wilshaw Grove, Ashton-under-lyne OL7 9QT
| Today | See what it's worth now |
| 19 Feb 2026 | £205,000 |
| 25 Jan 2008 | £122,000 |
1, Glenthorne Drive, Ashton-under-lyne OL7 9DT

| Today | See what it's worth now |
| 19 Feb 2026 | £370,000 |
| 25 Oct 2022 | £336,500 |
31, Oaken Street, Ashton-under-lyne OL7 9PB

| Today | See what it's worth now |
| 18 Feb 2026 | £140,000 |
| 5 Apr 2002 | £39,000 |
No other historical records.
38, Firbank Close, Ashton-under-lyne OL7 0AD
| Today | See what it's worth now |
| 17 Feb 2026 | £108,000 |
| 28 Jul 2006 | £131,950 |
No other historical records.
27, Elgin Street, Ashton-under-lyne OL7 9AQ
| Today | See what it's worth now |
| 12 Feb 2026 | £175,000 |
| 29 Mar 2018 | £97,000 |
61, Atlas Street, Ashton-under-lyne OL7 9BB
| Today | See what it's worth now |
| 4 Feb 2026 | £315,000 |
No other historical records.
52, Keswick Avenue, Ashton-under-lyne OL7 9JH
| Today | See what it's worth now |
| 4 Feb 2026 | £265,000 |
| 10 Mar 2006 | £109,500 |
11, Mansfield Close, Ashton-under-lyne OL7 0HG
| Today | See what it's worth now |
| 30 Jan 2026 | £186,000 |
| 23 Mar 2018 | £128,000 |
196, Burlington Street, Ashton-under-lyne OL7 0AE
| Today | See what it's worth now |
| 30 Jan 2026 | £218,000 |
| 9 Sep 2016 | £128,000 |
No other historical records.
195, Stockport Road, Ashton-under-lyne OL7 0NP
| Today | See what it's worth now |
| 29 Jan 2026 | £200,000 |
| 3 Nov 2015 | £125,000 |
No other historical records.
14, Springwood Hall, Oldham Road, Ashton-under-lyne OL7 9RH
| Today | See what it's worth now |
| 28 Jan 2026 | £109,500 |
| 15 Dec 1995 | £36,950 |
No other historical records.
99, Minto Street, Ashton-under-lyne OL7 9DA
| Today | See what it's worth now |
| 27 Jan 2026 | £131,600 |
| 29 Mar 2004 | £52,500 |
31, Camberwell Drive, Ashton-under-lyne OL7 9SW
| Today | See what it's worth now |
| 26 Jan 2026 | £275,000 |
| 18 May 2010 | £167,950 |
20, Langham Street, Ashton-under-lyne OL7 9EA

| Today | See what it's worth now |
| 16 Jan 2026 | £165,000 |
| 8 Sep 2010 | £50,000 |
No other historical records.
62, Minto Street, Ashton-under-lyne OL7 9DA
| Today | See what it's worth now |
| 14 Jan 2026 | £130,000 |
| 1 May 2014 | £30,000 |

Source Acknowledgement: © Crown copyright. England and Wales house price data is publicly available information produced by the HM Land Registry.This material was last updated on 9 July 2026. It covers the period from 1 January 1995 to 30 April 2026 and contains property transactions which have been registered during that period. Contains HM Land Registry data © Crown copyright and database right 2026. This data is licensed under the Open Government Licence v3.0.
Disclaimer: Rightmove.co.uk provides this HM Land Registry data "as is". The burden for fitness of the data relies completely with the user and is provided for informational purposes only. No warranty, express or implied, is given relating to the accuracy of content of the HM Land Registry data and Rightmove does not accept any liability for error or omission. If you have found an error with the data or need further information please contact HM Land Registry.
Permitted Use: Viewers of this Information are granted permission to access this Crown copyright material and to download it onto electronic, magnetic, optical or similar storage media provided that such activities are for private research, study or in-house use only. Any other use of the material requires the formal written permission of Land Registry which can be requested from us, and is subject to an additional licence and associated charge.
Rightmove takes no liability for your use of, or reliance on, Rightmove's Instant Valuation due to the limitations of our tracking tool listed here. Use of this tool is taken entirely at your own risk. All rights reserved.