
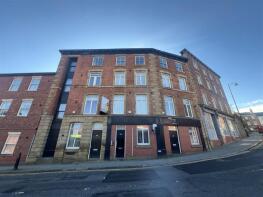
House Prices in SK1
House prices in SK1 have an overall average of £254,041 over the last year.
The majority of properties sold in SK1 during the last year were terraced properties, selling for an average price of £212,822. Semi-detached properties sold for an average of £261,544, with flats fetching £380,900.
Overall, the historical sold prices in SK1 over the last year were 30% up on the previous year and 37% up on the 2022 peak of £185,481.
Properties Sold
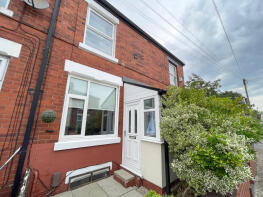
37, Ellwood Road, Offerton, Stockport SK1 4BE

| Today | See what it's worth now |
| 17 Apr 2026 | £192,000 |
| 23 Jan 2002 | £58,000 |
No other historical records.
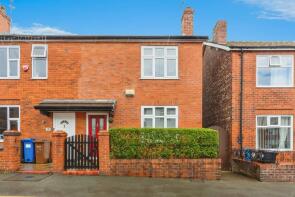
8, Paul Court, Hall Street, Offerton, Stockport SK1 4DE
| Today | See what it's worth now |
| 1 Apr 2026 | £160,000 |
| 11 Dec 2015 | £94,000 |
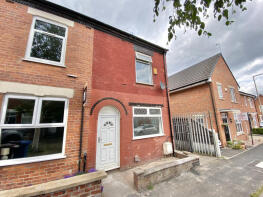
60, Caistor Street, Portwood, Stockport SK1 2LG
| Today | See what it's worth now |
| 30 Mar 2026 | £191,000 |
| 18 Dec 2015 | £95,000 |
Extensions and planning permission in SK1
See planning approval stats, extension build costs and value added estimates.

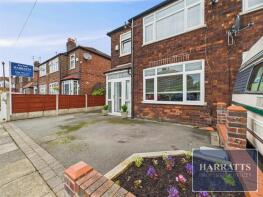
96, Charles Street, Heaviley, Stockport SK1 3JT
| Today | See what it's worth now |
| 30 Mar 2026 | £248,500 |
| 6 Apr 2023 | £192,000 |
Flat 3, 115 Abbey Court, Hall Street, Offerton, Stockport SK1 4HE
| Today | See what it's worth now |
| 27 Mar 2026 | £103,900 |
| 24 Feb 2021 | £92,000 |
86, Charles Street, Heaviley, Stockport SK1 3JT

| Today | See what it's worth now |
| 23 Mar 2026 | £184,500 |
| 22 May 2020 | £140,000 |
14, Windermere Road, Heaviley, Stockport SK1 4NF

| Today | See what it's worth now |
| 20 Mar 2026 | £268,500 |
| 10 Nov 2017 | £160,000 |
No other historical records.
8, Ennerdale Road, Heaviley, Stockport SK1 4NR
| Today | See what it's worth now |
| 13 Mar 2026 | £308,650 |
| 10 Feb 2006 | £143,500 |
63, Forbes Road, Offerton, Stockport SK1 4HQ
| Today | See what it's worth now |
| 13 Mar 2026 | £360,000 |
| 17 Dec 1999 | £65,800 |
No other historical records.
45, Hatters Court, Stockport SK1 3EB
| Today | See what it's worth now |
| 6 Mar 2026 | £180,000 |
| 28 Feb 2006 | £117,560 |
No other historical records.
18, Crescent Road, Portwood, Stockport SK1 2QG
| Today | See what it's worth now |
| 3 Mar 2026 | £315,000 |
No other historical records.
49, Yates Street, Portwood, Stockport SK1 2LJ
| Today | See what it's worth now |
| 25 Feb 2026 | £210,000 |
| 18 Oct 2017 | £135,000 |
16, Celtic Street, Offerton, Stockport SK1 4EQ
| Today | See what it's worth now |
| 20 Feb 2026 | £246,000 |
| 7 Dec 2015 | £85,000 |
No other historical records.
63, Patterdale Road, Heaviley, Stockport SK1 4NL

| Today | See what it's worth now |
| 18 Feb 2026 | £245,000 |
| 21 Jan 2022 | £250,000 |
125, Charles Street, Heaviley, Stockport SK1 3JT
| Today | See what it's worth now |
| 11 Feb 2026 | £200,000 |
| 28 Jun 1999 | £39,000 |
No other historical records.
9, Hillbrook Road, Offerton, Stockport SK1 4JW
| Today | See what it's worth now |
| 5 Feb 2026 | £277,000 |
| 2 Aug 2006 | £145,000 |
No other historical records.
143, Hempshaw Lane, Offerton, Stockport SK1 4LP
| Today | See what it's worth now |
| 30 Jan 2026 | £230,000 |
| 13 May 2008 | £120,000 |
No other historical records.
4, Hinton Mews, Turncroft Lane, Offerton, Stockport SK1 4AX
| Today | See what it's worth now |
| 30 Jan 2026 | £205,000 |
| 17 Aug 2023 | £168,000 |
Apartment 7, St Marys Gate, Churchgate, Stockport SK1 1AS

| Today | See what it's worth now |
| 28 Jan 2026 | £230,000 |
No other historical records.
20, Ebbdale Close, Stockport SK1 3LP

| Today | See what it's worth now |
| 8 Jan 2026 | £224,000 |
No other historical records.
340, Turncroft Lane, Offerton, Stockport SK1 4BP
| Today | See what it's worth now |
| 5 Jan 2026 | £197,250 |
| 23 Mar 2006 | £75,000 |
No other historical records.
3, Woodbank Avenue, Offerton, Stockport SK1 4JL
| Today | See what it's worth now |
| 19 Dec 2025 | £315,000 |
| 26 Feb 2021 | £246,000 |
12, Hanson Mews, Offerton, Stockport SK1 4HS
| Today | See what it's worth now |
| 19 Dec 2025 | £222,500 |
| 21 Jan 2005 | £155,000 |

Source Acknowledgement: © Crown copyright. England and Wales house price data is publicly available information produced by the HM Land Registry.This material was last updated on 9 July 2026. It covers the period from 1 January 1995 to 30 April 2026 and contains property transactions which have been registered during that period. Contains HM Land Registry data © Crown copyright and database right 2026. This data is licensed under the Open Government Licence v3.0.
Disclaimer: Rightmove.co.uk provides this HM Land Registry data "as is". The burden for fitness of the data relies completely with the user and is provided for informational purposes only. No warranty, express or implied, is given relating to the accuracy of content of the HM Land Registry data and Rightmove does not accept any liability for error or omission. If you have found an error with the data or need further information please contact HM Land Registry.
Permitted Use: Viewers of this Information are granted permission to access this Crown copyright material and to download it onto electronic, magnetic, optical or similar storage media provided that such activities are for private research, study or in-house use only. Any other use of the material requires the formal written permission of Land Registry which can be requested from us, and is subject to an additional licence and associated charge.
Rightmove takes no liability for your use of, or reliance on, Rightmove's Instant Valuation due to the limitations of our tracking tool listed here. Use of this tool is taken entirely at your own risk. All rights reserved.