
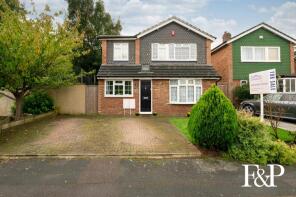
House Prices in SL1
House prices in SL1 have an overall average of £413,163 over the last year.
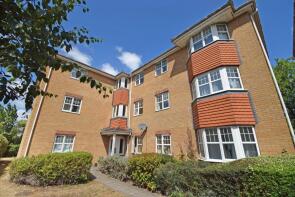
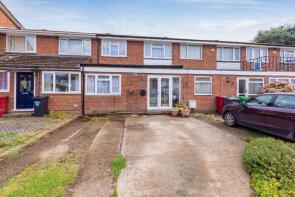
The majority of properties sold in SL1 during the last year were semi-detached properties, selling for an average price of £463,722. Terraced properties sold for an average of £393,261, with flats fetching £226,615.
Overall, the historical sold prices in SL1 over the last year were 1% up on the previous year and 7% up on the 2023 peak of £386,306.
Properties Sold
38, Kings Road, Slough SL1 2PT
| Today | See what it's worth now |
| 24 Apr 2026 | £442,000 |
| 4 Jul 2002 | £140,000 |
No other historical records.
103, Stomp Road, Slough SL1 7NN

| Today | See what it's worth now |
| 16 Apr 2026 | £585,000 |
| 3 May 2009 | £222,500 |
No other historical records.
1, Olive Tree Cottages, Eastfield Road, Slough SL1 7EL
| Today | See what it's worth now |
| 9 Apr 2026 | £550,000 |
| 29 Sep 2021 | £522,500 |
Extensions and planning permission in SL1
See planning approval stats, extension build costs and value added estimates.

66, Rutland Avenue, Slough SL1 3AL
| Today | See what it's worth now |
| 8 Apr 2026 | £205,000 |
| 25 Aug 2006 | £215,000 |
No other historical records.
6, First Crescent, Slough SL1 3AU
| Today | See what it's worth now |
| 8 Apr 2026 | £525,000 |
No other historical records.
63, Lowestoft Drive, Slough SL1 6PB
| Today | See what it's worth now |
| 8 Apr 2026 | £405,000 |
| 25 Oct 2019 | £353,500 |
14, Edwards Court, Slough SL1 2HY

| Today | See what it's worth now |
| 31 Mar 2026 | £230,000 |
| 28 May 2014 | £169,000 |
117, Burnham Lane, Slough SL1 6LA
| Today | See what it's worth now |
| 31 Mar 2026 | £620,000 |
| 7 Jun 2005 | £330,000 |
No other historical records.
59, Lent Rise Road, Slough SL1 7NY
| Today | See what it's worth now |
| 27 Mar 2026 | £376,000 |
| 16 Aug 2013 | £268,500 |
90, Aspects Court, Slough SL1 2EZ
| Today | See what it's worth now |
| 27 Mar 2026 | £255,000 |
| 12 Aug 2021 | £275,000 |
93, Ragstone Road, Slough SL1 2PR
| Today | See what it's worth now |
| 27 Mar 2026 | £380,000 |
| 21 Jun 2006 | £185,000 |
33, Bruce Close, Slough SL1 9AS
| Today | See what it's worth now |
| 27 Mar 2026 | £275,000 |
| 19 Oct 2021 | £227,000 |
18, Petty Cross, Slough SL1 6JB
| Today | See what it's worth now |
| 27 Mar 2026 | £231,000 |
| 28 Jun 2002 | £129,995 |
No other historical records.
46, Fotheringay Gardens, Slough SL1 5SR

| Today | See what it's worth now |
| 27 Mar 2026 | £115,000 |
| 26 Apr 2016 | £105,000 |
19, Mercian Way, Slough SL1 5NA
| Today | See what it's worth now |
| 27 Mar 2026 | £430,500 |
No other historical records.
Flat 3, 23, Upton Park, Slough SL1 2DA
| Today | See what it's worth now |
| 26 Mar 2026 | £186,000 |
| 25 Apr 2024 | £138,250 |
8, Pepler Way, Slough SL1 7DS
| Today | See what it's worth now |
| 24 Mar 2026 | £395,000 |
| 28 Jun 2021 | £355,000 |
36, Green Lane, Slough SL1 8DX
| Today | See what it's worth now |
| 23 Mar 2026 | £1,145,000 |
| 1 Oct 2009 | £625,000 |
No other historical records.
42, Long Drive, Slough SL1 8AL
| Today | See what it's worth now |
| 20 Mar 2026 | £690,000 |
| 18 Oct 2006 | £310,000 |
No other historical records.
62, Telford Drive, Slough SL1 9AB

| Today | See what it's worth now |
| 20 Mar 2026 | £167,500 |
| 11 Jul 2003 | £105,000 |
82, Dropmore Road, Slough SL1 8AU

| Today | See what it's worth now |
| 20 Mar 2026 | £1,000,000 |
| 11 Aug 2010 | £625,000 |
1, Scarborough Way, Slough SL1 9JY
| Today | See what it's worth now |
| 20 Mar 2026 | £370,000 |
| 16 Dec 2005 | £186,000 |
Flat 9, 29, Sussex Place, Slough SL1 1NF
| Today | See what it's worth now |
| 17 Mar 2026 | £163,500 |
| 26 May 2000 | £59,500 |
No other historical records.
Source Acknowledgement: © Crown copyright. England and Wales house price data is publicly available information produced by the HM Land Registry.This material was last updated on 9 July 2026. It covers the period from 1 January 1995 to 30 April 2026 and contains property transactions which have been registered during that period. Contains HM Land Registry data © Crown copyright and database right 2026. This data is licensed under the Open Government Licence v3.0.
Disclaimer: Rightmove.co.uk provides this HM Land Registry data "as is". The burden for fitness of the data relies completely with the user and is provided for informational purposes only. No warranty, express or implied, is given relating to the accuracy of content of the HM Land Registry data and Rightmove does not accept any liability for error or omission. If you have found an error with the data or need further information please contact HM Land Registry.
Permitted Use: Viewers of this Information are granted permission to access this Crown copyright material and to download it onto electronic, magnetic, optical or similar storage media provided that such activities are for private research, study or in-house use only. Any other use of the material requires the formal written permission of Land Registry which can be requested from us, and is subject to an additional licence and associated charge.
Rightmove takes no liability for your use of, or reliance on, Rightmove's Instant Valuation due to the limitations of our tracking tool listed here. Use of this tool is taken entirely at your own risk. All rights reserved.