
House Prices in SS11
House prices in SS11 have an overall average of £444,553 over the last year.
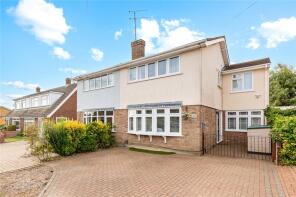
The majority of properties sold in SS11 during the last year were semi-detached properties, selling for an average price of £407,200. Detached properties sold for an average of £616,287, with terraced properties fetching £341,519.
Overall, the historical sold prices in SS11 over the last year were 9% up on the previous year and 2% up on the 2022 peak of £436,433.
Properties Sold
23, Egbert Gardens, Runwell, Wickford SS11 7BH
| Today | See what it's worth now |
| 24 Apr 2026 | £325,000 |
| 25 Apr 2025 | £297,000 |
No other historical records.
8, Fanton Walk, Shotgate, Wickford SS11 8QT
| Today | See what it's worth now |
| 14 Apr 2026 | £795,000 |
| 1 Jul 2019 | £619,000 |
No other historical records.
88, Bruce Grove, Wickford SS11 8QJ
| Today | See what it's worth now |
| 10 Apr 2026 | £373,000 |
| 30 Mar 2012 | £184,000 |
Extensions and planning permission in SS11
See planning approval stats, extension build costs and value added estimates.

6, Cygnet Court, Swan Lane, Wickford SS11 7DB

| Today | See what it's worth now |
| 8 Apr 2026 | £220,000 |
| 31 Oct 2023 | £215,000 |
36, Royal Oak Drive, Wickford SS11 8NT
| Today | See what it's worth now |
| 8 Apr 2026 | £300,000 |
| 28 Feb 2014 | £160,000 |
25, Downham Road, Runwell, Wickford SS11 7LY

| Today | See what it's worth now |
| 8 Apr 2026 | £350,000 |
| 29 Jul 2005 | £187,500 |
112, Bridge Road, Wickford SS11 8PE
| Today | See what it's worth now |
| 2 Apr 2026 | £217,500 |
| 27 Jan 2023 | £234,500 |
187, Southend Road, Wickford SS11 8EF
| Today | See what it's worth now |
| 31 Mar 2026 | £425,000 |
| 9 Aug 2013 | £185,500 |
No other historical records.
87, Southend Road, Wickford SS11 8DX
| Today | See what it's worth now |
| 31 Mar 2026 | £535,000 |
| 23 Oct 1998 | £120,000 |
No other historical records.
44, Wick Lane, Wickford SS11 8AR
| Today | See what it's worth now |
| 30 Mar 2026 | £357,500 |
| 19 Nov 2018 | £295,000 |
20, Fanton Walk, Shotgate, Wickford SS11 8QT
| Today | See what it's worth now |
| 30 Mar 2026 | £476,500 |
| 2 Nov 2016 | £395,000 |
234, Beauchamps Drive, Wickford SS11 8NF
| Today | See what it's worth now |
| 27 Mar 2026 | £177,500 |
No other historical records.
40, Downham Road, Runwell, Wickford SS11 7LX
| Today | See what it's worth now |
| 27 Mar 2026 | £540,000 |
| 31 Aug 2021 | £500,000 |
25, Saxon Close, Runwell, Wickford SS11 7EU
| Today | See what it's worth now |
| 27 Mar 2026 | £600,000 |
| 28 Feb 2011 | £345,000 |
No other historical records.
23, Seven Acres, Wickford SS11 8JA

| Today | See what it's worth now |
| 27 Mar 2026 | £415,000 |
| 19 Nov 2021 | £380,000 |
No other historical records.
18, Highcliffe Close, Wickford SS11 8JZ
| Today | See what it's worth now |
| 25 Mar 2026 | £435,000 |
| 21 Jun 2006 | £227,500 |
32, Beauchamps Drive, Wickford SS11 8NL
| Today | See what it's worth now |
| 25 Mar 2026 | £460,000 |
| 22 Aug 2014 | £290,000 |
34, Rectory Grove, Wickford SS11 8ER
| Today | See what it's worth now |
| 25 Mar 2026 | £435,000 |
| 22 Oct 2014 | £289,995 |
19, Sandown Road, Shotgate, Wickford SS11 8PA

| Today | See what it's worth now |
| 20 Mar 2026 | £690,000 |
| 8 Aug 2003 | £228,000 |
No other historical records.
9, Fanton Chase, Shotgate, Wickford SS11 8QX
| Today | See what it's worth now |
| 12 Mar 2026 | £735,000 |
| 4 May 2012 | £365,000 |
No other historical records.
179, Beauchamps Drive, Wickford SS11 8NS
| Today | See what it's worth now |
| 6 Mar 2026 | £410,000 |
| 27 Aug 2002 | £147,995 |
No other historical records.
3, Wood Cottages, Brock Hill, South Hanningfield, Wickford SS11 7PA
| Today | See what it's worth now |
| 27 Feb 2026 | £575,000 |
| 28 Feb 2019 | £395,000 |
39, Long Meadow Drive, Wickford SS11 8AY
| Today | See what it's worth now |
| 27 Feb 2026 | £355,000 |
| 27 Sep 2023 | £340,000 |

Source Acknowledgement: © Crown copyright. England and Wales house price data is publicly available information produced by the HM Land Registry.This material was last updated on 9 July 2026. It covers the period from 1 January 1995 to 30 April 2026 and contains property transactions which have been registered during that period. Contains HM Land Registry data © Crown copyright and database right 2026. This data is licensed under the Open Government Licence v3.0.
Disclaimer: Rightmove.co.uk provides this HM Land Registry data "as is". The burden for fitness of the data relies completely with the user and is provided for informational purposes only. No warranty, express or implied, is given relating to the accuracy of content of the HM Land Registry data and Rightmove does not accept any liability for error or omission. If you have found an error with the data or need further information please contact HM Land Registry.
Permitted Use: Viewers of this Information are granted permission to access this Crown copyright material and to download it onto electronic, magnetic, optical or similar storage media provided that such activities are for private research, study or in-house use only. Any other use of the material requires the formal written permission of Land Registry which can be requested from us, and is subject to an additional licence and associated charge.
Rightmove takes no liability for your use of, or reliance on, Rightmove's Instant Valuation due to the limitations of our tracking tool listed here. Use of this tool is taken entirely at your own risk. All rights reserved.