
House Prices in SY13
House prices in SY13 have an overall average of £306,054 over the last year.
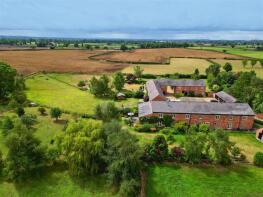
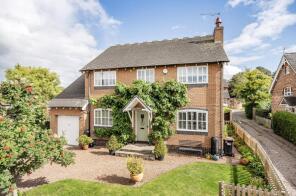
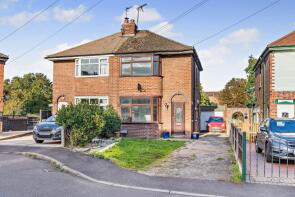
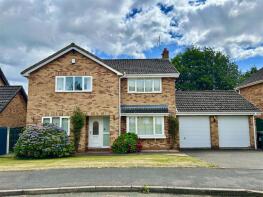
The majority of properties sold in SY13 during the last year were detached properties, selling for an average price of £404,104. Terraced properties sold for an average of £224,660, with semi-detached properties fetching £254,045.
Overall, the historical sold prices in SY13 over the last year were 4% up on the previous year and similar to the 2022 peak of £306,500.
Properties Sold
2, Chapel View, Bettisfield, Whitchurch SY13 2LU
| Today | See what it's worth now |
| 10 Apr 2026 | £375,000 |
| 19 Mar 2007 | £305,000 |
15 The Haven, Mill Street, Whitchurch SY13 2DL
| Today | See what it's worth now |
| 10 Apr 2026 | £270,000 |
| 17 Dec 2019 | £197,500 |
54, Alport Road, Whitchurch SY13 1NR
| Today | See what it's worth now |
| 8 Apr 2026 | £367,000 |
| 27 May 2005 | £250,000 |
No other historical records.
Extensions and planning permission in SY13
See planning approval stats, extension build costs and value added estimates.

3, The Old White House, Claypit Street, Whitchurch SY13 1LE
| Today | See what it's worth now |
| 8 Apr 2026 | £280,000 |
| 17 Nov 2017 | £170,000 |
Darwin Oaks, The Grange Barns, Grange Road, Bronington, Whitchurch SY13 3HL
| Today | See what it's worth now |
| 31 Mar 2026 | £660,000 |
| 17 Aug 2018 | £590,000 |
Rowan House, School Lane, Whitchurch SY13 4LH
| Today | See what it's worth now |
| 31 Mar 2026 | £483,500 |
| 6 Jan 1997 | £126,950 |
No other historical records.
Sparrow Field House, Moreton Street, Whitchurch SY13 2EQ
| Today | See what it's worth now |
| 27 Mar 2026 | £690,000 |
| 20 Aug 2021 | £619,000 |
No other historical records.
8, Rylands Drive, Waymills, Whitchurch SY13 1FS
| Today | See what it's worth now |
| 27 Mar 2026 | £220,000 |
| 25 Oct 2024 | £210,000 |
No other historical records.
8, Rydal Avenue, Whitchurch SY13 1ET
| Today | See what it's worth now |
| 27 Mar 2026 | £170,000 |
| 28 Apr 2017 | £127,500 |
No other historical records.
12, Greenfields Rise, Whitchurch SY13 1EP
| Today | See what it's worth now |
| 27 Mar 2026 | £410,000 |
| 13 Oct 2000 | £132,000 |
9, Belton Road, Whitchurch SY13 1HZ
| Today | See what it's worth now |
| 25 Mar 2026 | £185,000 |
| 7 May 2021 | £135,000 |
32, Brownlow Street, Whitchurch SY13 1QS
| Today | See what it's worth now |
| 24 Mar 2026 | £172,000 |
| 30 Sep 2016 | £120,000 |
97, Wrexham Road, Whitchurch SY13 1HX
| Today | See what it's worth now |
| 20 Mar 2026 | £230,000 |
| 26 Jul 2019 | £152,500 |
2, Meadowcroft, Whitchurch SY13 1BD
| Today | See what it's worth now |
| 19 Mar 2026 | £420,000 |
| 6 Jun 2007 | £285,000 |
4, Brades Road, Prees SY13 2DU
| Today | See what it's worth now |
| 16 Mar 2026 | £195,000 |
No other historical records.
2, Sylvan Close, Higher Heath, Whitchurch SY13 2TB
| Today | See what it's worth now |
| 12 Mar 2026 | £345,000 |
| 27 Oct 2023 | £275,000 |
No other historical records.
40, Station Road, Whitchurch SY13 1RE
| Today | See what it's worth now |
| 12 Mar 2026 | £323,000 |
| 17 Mar 2006 | £165,000 |
No other historical records.
Mermaid Cottage, Moreton Street, Whitchurch SY13 2EG
| Today | See what it's worth now |
| 6 Mar 2026 | £490,000 |
| 12 Aug 2021 | £430,000 |
18, George Street, Whitchurch SY13 1NY
| Today | See what it's worth now |
| 3 Mar 2026 | £135,000 |
| 10 Dec 1996 | £21,500 |
No other historical records.
3, Neufchatel Court, Neufchatel Close, Whitchurch SY13 1TY
| Today | See what it's worth now |
| 2 Mar 2026 | £155,000 |
| 26 Mar 2021 | £135,000 |
66, Smallbrook Road, Whitchurch SY13 1BX
| Today | See what it's worth now |
| 27 Feb 2026 | £165,000 |
| 7 Jun 2013 | £90,000 |
No other historical records.
15 Waterside Cottage, Chester Road, Grindley Brook, Whitchurch SY13 4QH

| Today | See what it's worth now |
| 27 Feb 2026 | £315,000 |
| 30 Sep 2014 | £275,000 |
14, Timekeepers Way, Whitchurch SY13 1WG
| Today | See what it's worth now |
| 23 Feb 2026 | £327,000 |
| 17 Dec 2019 | £270,000 |
No other historical records.
Source Acknowledgement: © Crown copyright. England and Wales house price data is publicly available information produced by the HM Land Registry.This material was last updated on 9 July 2026. It covers the period from 1 January 1995 to 30 April 2026 and contains property transactions which have been registered during that period. Contains HM Land Registry data © Crown copyright and database right 2026. This data is licensed under the Open Government Licence v3.0.
Disclaimer: Rightmove.co.uk provides this HM Land Registry data "as is". The burden for fitness of the data relies completely with the user and is provided for informational purposes only. No warranty, express or implied, is given relating to the accuracy of content of the HM Land Registry data and Rightmove does not accept any liability for error or omission. If you have found an error with the data or need further information please contact HM Land Registry.
Permitted Use: Viewers of this Information are granted permission to access this Crown copyright material and to download it onto electronic, magnetic, optical or similar storage media provided that such activities are for private research, study or in-house use only. Any other use of the material requires the formal written permission of Land Registry which can be requested from us, and is subject to an additional licence and associated charge.
Rightmove takes no liability for your use of, or reliance on, Rightmove's Instant Valuation due to the limitations of our tracking tool listed here. Use of this tool is taken entirely at your own risk. All rights reserved.