
House Prices in Selsdon Parade
House prices in Selsdon Parade have an overall average of £614,641 over the last year.
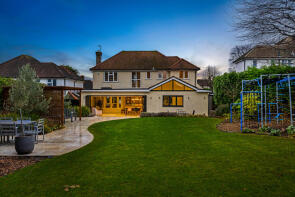
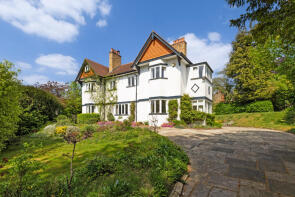
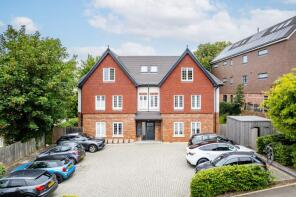
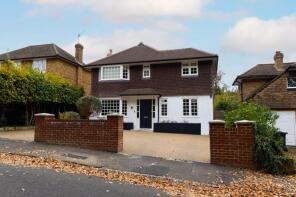
The majority of properties sold in Selsdon Parade during the last year were detached properties, selling for an average price of £858,756. Flats sold for an average of £316,283, with semi-detached properties fetching £648,619.
Overall, the historical sold prices in Selsdon Parade over the last year were 5% up on the previous year and 3% up on the 2022 peak of £597,577.
Properties Sold
18, Briton Crescent, South Croydon CR2 0JE
| Today | See what it's worth now |
| 16 Apr 2026 | £1,201,500 |
| 1 Aug 2016 | £890,000 |
31, Grange Road, South Croydon CR2 0NE
| Today | See what it's worth now |
| 16 Apr 2026 | £465,000 |
| 7 Sep 2007 | £248,000 |
No other historical records.
85, Sanderstead Road, South Croydon CR2 0PF
| Today | See what it's worth now |
| 2 Apr 2026 | £430,000 |
| 24 Aug 2017 | £425,000 |
13a, Florence Road, South Croydon CR2 0PQ
| Today | See what it's worth now |
| 30 Mar 2026 | £570,000 |
No other historical records.
2a, Edgar Road, South Croydon CR2 0NG
| Today | See what it's worth now |
| 27 Mar 2026 | £425,000 |
| 15 Feb 2016 | £330,000 |
No other historical records.
Flat 9, 9, Wettern Close, South Croydon CR2 0NT
| Today | See what it's worth now |
| 25 Mar 2026 | £312,000 |
No other historical records.
Flat 3, 2, West Hill, South Croydon CR2 0SA
| Today | See what it's worth now |
| 20 Mar 2026 | £342,500 |
| 10 Dec 2020 | £435,000 |
No other historical records.
20a, Glossop Road, South Croydon CR2 0PU
| Today | See what it's worth now |
| 20 Mar 2026 | £315,000 |
| 15 Dec 2017 | £310,000 |
22, Beechwood Road, South Croydon CR2 0AA
| Today | See what it's worth now |
| 16 Mar 2026 | £1,032,500 |
| 3 Oct 2011 | £473,000 |
No other historical records.
Flat 2, 6, Parrs Close, South Croydon CR2 0QX
| Today | See what it's worth now |
| 6 Mar 2026 | £282,000 |
| 2 Feb 2015 | £241,000 |
Flat 6, 1, West Hill, South Croydon CR2 0SB
| Today | See what it's worth now |
| 27 Feb 2026 | £316,000 |
| 23 Mar 2016 | £420,000 |
No other historical records.
14, Heathhurst Road, South Croydon CR2 0BA
| Today | See what it's worth now |
| 26 Feb 2026 | £895,000 |
| 23 May 1997 | £179,950 |
No other historical records.
Culver House, Sanderstead Road, South Croydon CR2 0AG
| Today | See what it's worth now |
| 18 Feb 2026 | £952,500 |
No other historical records.
Flat 7, 1a Aston House, West Hill, South Croydon CR2 0SB
| Today | See what it's worth now |
| 30 Jan 2026 | £400,000 |
| 28 Sep 2020 | £420,000 |
No other historical records.
93, Elmfield Way, South Croydon CR2 0EH
| Today | See what it's worth now |
| 26 Jan 2026 | £880,000 |
| 8 May 2019 | £550,000 |
No other historical records.
16, Croham Mount, South Croydon CR2 0BR

| Today | See what it's worth now |
| 22 Jan 2026 | £600,000 |
| 30 Apr 2024 | £390,000 |
No other historical records.
Flat 1, 153, Sanderstead Road, South Croydon CR2 0PH

| Today | See what it's worth now |
| 21 Jan 2026 | £248,000 |
| 17 Jun 2020 | £250,000 |
167, Ridge Langley, South Croydon CR2 0AQ
| Today | See what it's worth now |
| 16 Jan 2026 | £418,000 |
| 1 Jun 2001 | £75,000 |
1, Lauriston Villas, Sanderstead Road, South Croydon CR2 0PG
| Today | See what it's worth now |
| 2 Jan 2026 | £244,000 |
| 19 Jun 2015 | £236,000 |
56, Church Way, South Croydon CR2 0JR
| Today | See what it's worth now |
| 19 Dec 2025 | £485,000 |
No other historical records.
Flat 18, 174 Vantage Point, Sanderstead Road, South Croydon CR2 0LY
| Today | See what it's worth now |
| 19 Dec 2025 | £300,001 |
| 13 Dec 2007 | £225,000 |
No other historical records.
39, West Hill, South Croydon CR2 0SB
| Today | See what it's worth now |
| 18 Dec 2025 | £1,200,000 |
| 30 Jun 2000 | £349,950 |
No other historical records.
9, Victoria Avenue, South Croydon CR2 0QP
| Today | See what it's worth now |
| 18 Dec 2025 | £600,000 |
| 22 Oct 2002 | £320,000 |
No other historical records.

Source Acknowledgement: © Crown copyright. England and Wales house price data is publicly available information produced by the HM Land Registry.This material was last updated on 9 July 2026. It covers the period from 1 January 1995 to 30 April 2026 and contains property transactions which have been registered during that period. Contains HM Land Registry data © Crown copyright and database right 2026. This data is licensed under the Open Government Licence v3.0.
Disclaimer: Rightmove.co.uk provides this HM Land Registry data "as is". The burden for fitness of the data relies completely with the user and is provided for informational purposes only. No warranty, express or implied, is given relating to the accuracy of content of the HM Land Registry data and Rightmove does not accept any liability for error or omission. If you have found an error with the data or need further information please contact HM Land Registry.
Permitted Use: Viewers of this Information are granted permission to access this Crown copyright material and to download it onto electronic, magnetic, optical or similar storage media provided that such activities are for private research, study or in-house use only. Any other use of the material requires the formal written permission of Land Registry which can be requested from us, and is subject to an additional licence and associated charge.
Rightmove takes no liability for your use of, or reliance on, Rightmove's Instant Valuation due to the limitations of our tracking tool listed here. Use of this tool is taken entirely at your own risk. All rights reserved.