
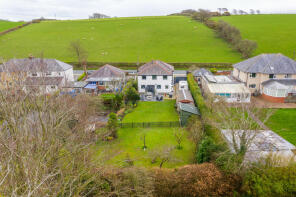
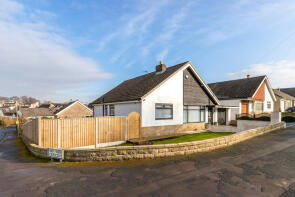
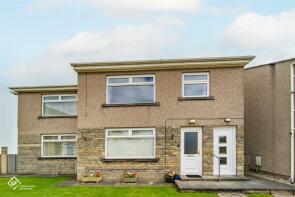
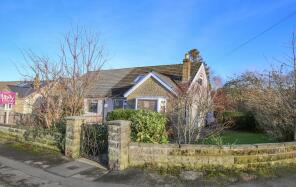
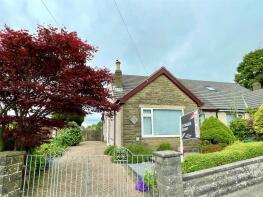
House Prices in Slyne
House prices in Slyne have an overall average of £327,938 over the last year.
The majority of properties sold in Slyne during the last year were detached properties, selling for an average price of £422,812. Semi-detached properties sold for an average of £214,929, with terraced properties fetching £360,000.
Overall, the historical sold prices in Slyne over the last year were 1% up on the previous year and 4% up on the 2021 peak of £316,683.
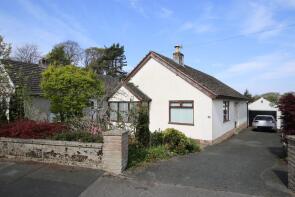
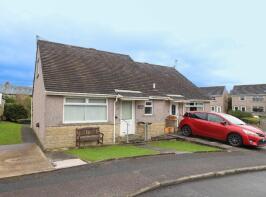
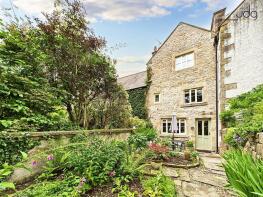
Properties Sold
2, Slyne Hall Heights, Lancaster LA2 6EH
| Today | See what it's worth now |
| 10 Apr 2026 | £380,000 |
| 30 Jun 2021 | £350,000 |
26, Croft Avenue, Lancaster LA2 6JJ
| Today | See what it's worth now |
| 20 Mar 2026 | £215,000 |
| 30 Jun 2010 | £165,950 |
115, Hest Bank Lane, Lancaster LA2 6AH
| Today | See what it's worth now |
| 20 Mar 2026 | £460,000 |
| 5 Dec 2002 | £220,000 |
No other historical records.
17, Bay View Avenue, Slyne LA2 6JR
| Today | See what it's worth now |
| 26 Jan 2026 | £325,000 |
No other historical records.
Newlyn, Lancaster Road, Lancaster LA2 6AS
| Today | See what it's worth now |
| 23 Jan 2026 | £485,000 |
| 15 Sep 2020 | £333,000 |
8, Bay View Crescent, Lancaster LA2 6JU
| Today | See what it's worth now |
| 15 Dec 2025 | £270,000 |
| 31 Jul 1997 | £60,000 |
No other historical records.
11, Arden Close, Lancaster LA2 6JN
| Today | See what it's worth now |
| 10 Dec 2025 | £123,000 |
| 19 Dec 2019 | £120,000 |
Holly Cottage, Green Lane, Lancaster LA1 2ES
| Today | See what it's worth now |
| 12 Nov 2025 | £360,000 |
| 16 Aug 2013 | £207,500 |
Slyne Grange, Main Road, Lancaster LA2 6AU
| Today | See what it's worth now |
| 11 Nov 2025 | £935,000 |
| 9 Aug 2002 | £305,000 |
27, Bay View Avenue, Lancaster LA2 6JS
| Today | See what it's worth now |
| 29 Sep 2025 | £297,500 |
| 19 Feb 2019 | £205,000 |
7, Shady Lane, Slyne, Slyne-with-hest LA2 6JL
| Today | See what it's worth now |
| 23 Sep 2025 | £180,000 |
No other historical records.
116, Main Road, Lancaster LA2 6AZ
| Today | See what it's worth now |
| 8 Sep 2025 | £270,000 |
| 14 Jul 2016 | £170,000 |
20, Warren Drive, Slyne LA2 6JT
| Today | See what it's worth now |
| 29 Aug 2025 | £335,000 |
No other historical records.
24, Croft Avenue, Slyne, Hest Bank LA2 6JJ
| Today | See what it's worth now |
| 30 Jul 2025 | £190,000 |
No other historical records.
53, Hest Bank Lane, Lancaster LA2 6BS
| Today | See what it's worth now |
| 18 Jul 2025 | £337,500 |
| 25 Sep 2023 | £260,000 |
No other historical records.
36, Arden Close, Lancaster LA2 6JN
| Today | See what it's worth now |
| 7 Jul 2025 | £84,000 |
| 2 May 2003 | £41,000 |
58, Hest Bank Lane, Lancaster LA2 6BS

| Today | See what it's worth now |
| 9 May 2025 | £376,500 |
| 23 Sep 2016 | £355,500 |
31, Manor Road, Lancaster LA2 6JY
| Today | See what it's worth now |
| 27 Mar 2025 | £276,500 |
| 13 Aug 2015 | £148,000 |
No other historical records.
19, Throstle Walk, Slyne LA2 6LD
| Today | See what it's worth now |
| 20 Mar 2025 | £252,500 |
No other historical records.
24, Manor Road, Lancaster LA2 6LB
| Today | See what it's worth now |
| 7 Feb 2025 | £220,000 |
| 6 Jul 2012 | £135,000 |
16, Arden Close, Lancaster LA2 6JN
| Today | See what it's worth now |
| 21 Jan 2025 | £150,000 |
| 20 Feb 2019 | £105,000 |
38, Manor Lane, Slyne LA2 6JE
| Today | See what it's worth now |
| 3 Jan 2025 | £385,000 |
No other historical records.
1, Summerfield Drive, Slyne LA2 6AQ
| Today | See what it's worth now |
| 19 Dec 2024 | £524,000 |
No other historical records.

Source Acknowledgement: © Crown copyright. England and Wales house price data is publicly available information produced by the HM Land Registry.This material was last updated on 9 July 2026. It covers the period from 1 January 1995 to 30 April 2026 and contains property transactions which have been registered during that period. Contains HM Land Registry data © Crown copyright and database right 2026. This data is licensed under the Open Government Licence v3.0.
Disclaimer: Rightmove.co.uk provides this HM Land Registry data "as is". The burden for fitness of the data relies completely with the user and is provided for informational purposes only. No warranty, express or implied, is given relating to the accuracy of content of the HM Land Registry data and Rightmove does not accept any liability for error or omission. If you have found an error with the data or need further information please contact HM Land Registry.
Permitted Use: Viewers of this Information are granted permission to access this Crown copyright material and to download it onto electronic, magnetic, optical or similar storage media provided that such activities are for private research, study or in-house use only. Any other use of the material requires the formal written permission of Land Registry which can be requested from us, and is subject to an additional licence and associated charge.
Rightmove takes no liability for your use of, or reliance on, Rightmove's Instant Valuation due to the limitations of our tracking tool listed here. Use of this tool is taken entirely at your own risk. All rights reserved.