
House Prices in Surbiton Hill
House prices in Surbiton Hill have an overall average of £595,761 over the last year.
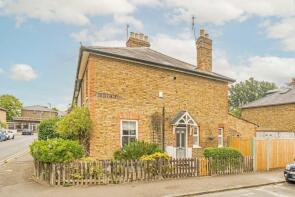
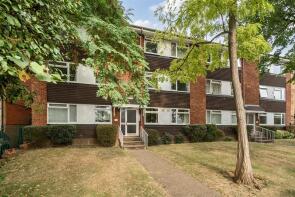
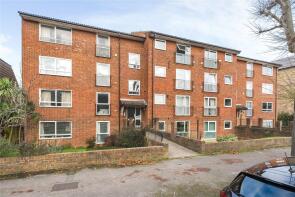
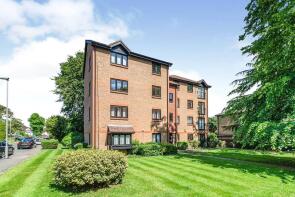
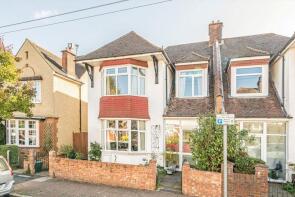
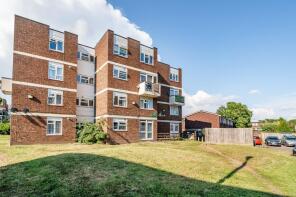
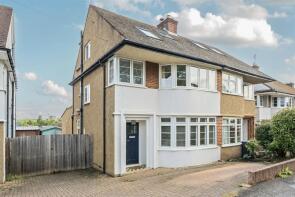
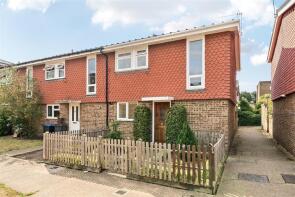
The majority of properties sold in Surbiton Hill during the last year were flats, selling for an average price of £354,935. Semi-detached properties sold for an average of £961,515, with terraced properties fetching £632,611.
Overall, the historical sold prices in Surbiton Hill over the last year were similar to the previous year and similar to the 2023 peak of £591,751.
Properties Sold
47, Minstrel Gardens, Surbiton KT5 8DX
| Today | See what it's worth now |
| 18 Mar 2026 | £276,000 |
| 26 Nov 2021 | £260,000 |
140, Chiltern Drive, Surbiton KT5 8LS
| Today | See what it's worth now |
| 11 Mar 2026 | £320,000 |
No other historical records.
11, Minniedale, Surbiton KT5 8DH
| Today | See what it's worth now |
| 26 Feb 2026 | £775,000 |
| 7 Aug 2014 | £570,000 |
Flat 2, 23, Berrylands Road, Surbiton KT5 8QX
| Today | See what it's worth now |
| 17 Feb 2026 | £265,000 |
| 9 Sep 2009 | £202,000 |
1a, Mayberry Place, Surbiton KT5 8SY
| Today | See what it's worth now |
| 13 Feb 2026 | £735,000 |
No other historical records.
Flat 6, 19 Highcroft, King Charles Road, Surbiton KT5 8NY
| Today | See what it's worth now |
| 3 Feb 2026 | £362,000 |
| 16 Aug 2002 | £170,000 |
Flat 23, Wren Court, The Avenue, Surbiton KT5 8JB
| Today | See what it's worth now |
| 30 Jan 2026 | £350,000 |
| 26 Aug 2022 | £347,500 |
Flat 3, 4, Berrylands, Surbiton KT5 8JE
| Today | See what it's worth now |
| 27 Jan 2026 | £370,000 |
| 29 Jul 2021 | £365,000 |
35, Chilham House, Adams Close, Surbiton KT5 8LB
| Today | See what it's worth now |
| 20 Jan 2026 | £320,000 |
| 9 Feb 2001 | £158,000 |
17, Guilford Avenue, Surbiton KT5 8DG
| Today | See what it's worth now |
| 19 Jan 2026 | £1,030,000 |
No other historical records.
2, 5 Merrow, Hobill Walk, Surbiton KT5 8SL
| Today | See what it's worth now |
| 15 Jan 2026 | £350,000 |
| 15 Jul 2016 | £310,000 |
No other historical records.
17, Cheyne Hill, Surbiton KT5 8BL
| Today | See what it's worth now |
| 9 Jan 2026 | £900,000 |
| 9 Sep 2010 | £477,500 |
24, Britannia Road, Surbiton KT5 8RT
| Today | See what it's worth now |
| 5 Jan 2026 | £450,000 |
| 7 Jul 2004 | £183,500 |
No other historical records.
7, Regent Road, Surbiton KT5 8NN
| Today | See what it's worth now |
| 19 Dec 2025 | £925,000 |
No other historical records.
223, Surbiton Hill Park, Surbiton KT5 8EN
| Today | See what it's worth now |
| 18 Dec 2025 | £330,000 |
| 23 Jan 2009 | £194,500 |
No other historical records.
217, Surbiton Hill Park, Surbiton KT5 8EN
| Today | See what it's worth now |
| 18 Dec 2025 | £310,000 |
| 31 Oct 2008 | £250,000 |
No other historical records.
Flat 5, 13, Cranes Drive, Surbiton KT5 8AJ
| Today | See what it's worth now |
| 1 Dec 2025 | £325,000 |
| 12 Nov 2015 | £370,000 |
45, Cheyne Hill, Surbiton KT5 8BL
| Today | See what it's worth now |
| 24 Nov 2025 | £880,000 |
| 30 Nov 2012 | £565,000 |
75, Berrylands, Surbiton KT5 8JX
| Today | See what it's worth now |
| 24 Nov 2025 | £1,450,750 |
| 27 Jan 2021 | £1,250,000 |
67, Berrylands Road, Surbiton KT5 8PB
| Today | See what it's worth now |
| 21 Nov 2025 | £605,000 |
No other historical records.
45, King Charles Road, Surbiton KT5 8PF

| Today | See what it's worth now |
| 20 Nov 2025 | £1,300,000 |
| 26 Apr 1996 | £150,000 |
No other historical records.
5, Keston Court, Cranes Park, Surbiton KT5 8AF
| Today | See what it's worth now |
| 14 Nov 2025 | £315,000 |
No other historical records.
30, King Charles Crescent, Surbiton KT5 8SU
| Today | See what it's worth now |
| 7 Nov 2025 | £750,000 |
| 17 Oct 2019 | £605,000 |
Source Acknowledgement: © Crown copyright. England and Wales house price data is publicly available information produced by the HM Land Registry.This material was last updated on 15 May 2026. It covers the period from 1 January 1995 to 31 March 2026 and contains property transactions which have been registered during that period. Contains HM Land Registry data © Crown copyright and database right 2026. This data is licensed under the Open Government Licence v3.0.
Disclaimer: Rightmove.co.uk provides this HM Land Registry data "as is". The burden for fitness of the data relies completely with the user and is provided for informational purposes only. No warranty, express or implied, is given relating to the accuracy of content of the HM Land Registry data and Rightmove does not accept any liability for error or omission. If you have found an error with the data or need further information please contact HM Land Registry.
Permitted Use: Viewers of this Information are granted permission to access this Crown copyright material and to download it onto electronic, magnetic, optical or similar storage media provided that such activities are for private research, study or in-house use only. Any other use of the material requires the formal written permission of Land Registry which can be requested from us, and is subject to an additional licence and associated charge.
Map data ©OpenStreetMap contributors.
Rightmove takes no liability for your use of, or reliance on, Rightmove's Instant Valuation due to the limitations of our tracking tool listed here. Use of this tool is taken entirely at your own risk. All rights reserved.