
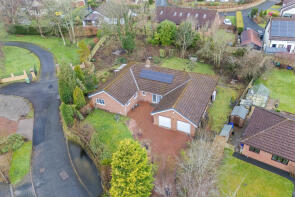
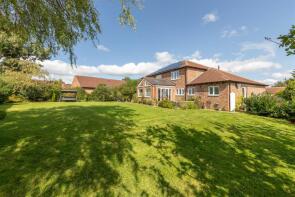
House Prices in Swarland
House prices in Swarland have an overall average of £523,207 over the last year.
The majority of properties sold in Swarland during the last year were detached properties, selling for an average price of £584,370. Terraced properties sold for an average of £247,975.
Overall, the historical sold prices in Swarland over the last year were 27% up on the previous year and 5% up on the 2022 peak of £497,598.
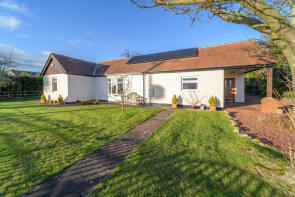
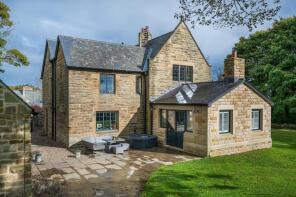
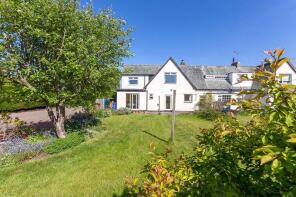
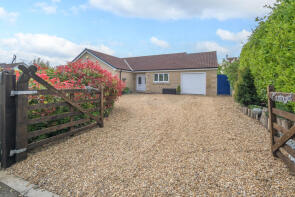
Properties Sold
42, Park Road, Morpeth NE65 9JD
| Today | See what it's worth now |
| 14 Apr 2026 | £640,000 |
| 18 Sep 2008 | £325,000 |
No other historical records.
4, Springwood, Morpeth NE65 9QS

| Today | See what it's worth now |
| 20 Mar 2026 | £610,000 |
| 12 Apr 2017 | £437,000 |
8 North Lodge, Park Road, Morpeth NE65 9JD
| Today | See what it's worth now |
| 16 Mar 2026 | £720,000 |
| 4 Apr 2019 | £550,000 |
7, Percy Drive, Morpeth NE65 9JN
| Today | See what it's worth now |
| 9 Dec 2025 | £560,000 |
| 9 Dec 2025 | £560,000 |
19, Coast View, Swarland NE65 9JG
| Today | See what it's worth now |
| 29 Oct 2025 | £246,000 |
No other historical records.
Eastwynd, Studley Drive, Morpeth NE65 9JT
| Today | See what it's worth now |
| 24 Oct 2025 | £495,330 |
| 12 Jul 2024 | £404,000 |
2 3, Home Farm Cottages, Morpeth NE65 9JH
| Today | See what it's worth now |
| 17 Oct 2025 | £249,950 |
No other historical records.
6b, Kenmore Road, Morpeth NE65 9JS
| Today | See what it's worth now |
| 8 Oct 2025 | £645,000 |
| 27 Aug 2021 | £435,000 |
Swarland Hall Cottage, Coast View, Morpeth NE65 9JF
| Today | See what it's worth now |
| 5 Sep 2025 | £375,000 |
| 18 Feb 1998 | £18,000 |
No other historical records.
3, Beechcroft, Morpeth NE65 9HA
| Today | See what it's worth now |
| 28 Aug 2025 | £654,000 |
| 16 Jul 2004 | £340,000 |
No other historical records.
29, Kenmore Road, Morpeth NE65 9JS
| Today | See what it's worth now |
| 16 Jun 2025 | £475,000 |
| 30 Sep 2022 | £390,000 |
6 Mallor, The Old Tweed Mill, Morpeth NE65 9LX
| Today | See what it's worth now |
| 29 May 2025 | £445,000 |
| 30 Sep 2008 | £285,000 |
No other historical records.
6, Kenmore Road, Swarland NE65 9JS
| Today | See what it's worth now |
| 29 May 2025 | £290,000 |
No other historical records.
5, Kenmore Road, Morpeth NE65 9JS
| Today | See what it's worth now |
| 24 Mar 2025 | £350,000 |
| 19 Jun 2001 | £130,000 |
No other historical records.
2 Moorfield House, Low Pastures, Morpeth NE65 9LZ
| Today | See what it's worth now |
| 14 Feb 2025 | £685,000 |
| 26 Nov 2020 | £458,000 |
2, Douglas Crescent, Morpeth NE65 9JB
| Today | See what it's worth now |
| 13 Feb 2025 | £220,000 |
| 7 Jul 2017 | £135,000 |
No other historical records.
4, Kenmore Drive, Swarland NE65 9QT
| Today | See what it's worth now |
| 19 Dec 2024 | £375,000 |
No other historical records.
Rosemead, Kenmore Road, Swarland NE65 9JS

| Today | See what it's worth now |
| 25 Oct 2024 | £270,000 |
No other historical records.
Briardene, Coast View, Morpeth NE65 9JG

| Today | See what it's worth now |
| 4 Oct 2024 | £440,000 |
| 3 May 2013 | £242,000 |
3, Hardy Close, Morpeth NE65 9PG

| Today | See what it's worth now |
| 20 Sep 2024 | £580,000 |
| 20 Apr 2010 | £400,000 |
No other historical records.
2, Kenmore Croft, Swarland NE65 9QU
| Today | See what it's worth now |
| 24 Jul 2024 | £400,000 |
No other historical records.
4, Nelson Drive, Morpeth NE65 9JR

| Today | See what it's worth now |
| 24 May 2024 | £268,000 |
| 14 Dec 2012 | £156,000 |
Linwood, Coast View, Morpeth NE65 9JG

| Today | See what it's worth now |
| 17 May 2024 | £375,000 |
No other historical records.
Source Acknowledgement: © Crown copyright. England and Wales house price data is publicly available information produced by the HM Land Registry.This material was last updated on 9 July 2026. It covers the period from 1 January 1995 to 30 April 2026 and contains property transactions which have been registered during that period. Contains HM Land Registry data © Crown copyright and database right 2026. This data is licensed under the Open Government Licence v3.0.
Disclaimer: Rightmove.co.uk provides this HM Land Registry data "as is". The burden for fitness of the data relies completely with the user and is provided for informational purposes only. No warranty, express or implied, is given relating to the accuracy of content of the HM Land Registry data and Rightmove does not accept any liability for error or omission. If you have found an error with the data or need further information please contact HM Land Registry.
Permitted Use: Viewers of this Information are granted permission to access this Crown copyright material and to download it onto electronic, magnetic, optical or similar storage media provided that such activities are for private research, study or in-house use only. Any other use of the material requires the formal written permission of Land Registry which can be requested from us, and is subject to an additional licence and associated charge.
Rightmove takes no liability for your use of, or reliance on, Rightmove's Instant Valuation due to the limitations of our tracking tool listed here. Use of this tool is taken entirely at your own risk. All rights reserved.