
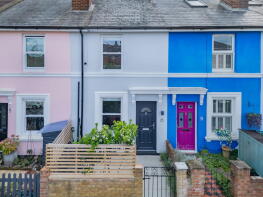
House Prices in TN1
House prices in TN1 have an overall average of £510,593 over the last year.
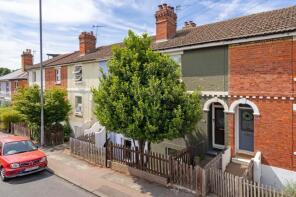
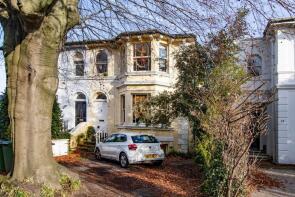
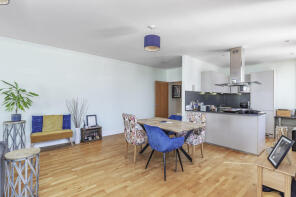
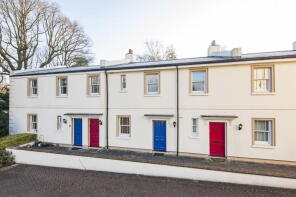
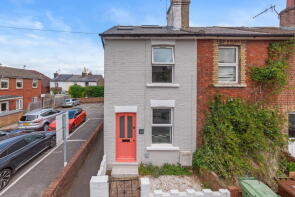
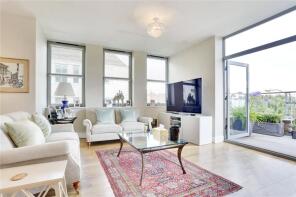
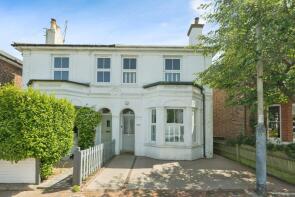
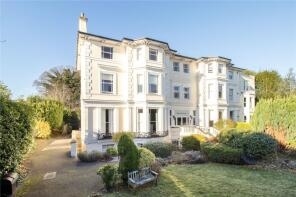
The majority of properties sold in TN1 during the last year were flats, selling for an average price of £282,183. Terraced properties sold for an average of £501,880, with semi-detached properties fetching £674,556.
Overall, the historical sold prices in TN1 over the last year were 8% up on the previous year and 5% up on the 2020 peak of £484,782.
Properties Sold
6, Stanhope Road, Tunbridge Wells TN1 2HY
| Today | See what it's worth now |
| 1 Apr 2026 | £335,000 |
| 30 May 2024 | £315,000 |
Flat 2, 143, Upper Grosvenor Road, Tunbridge Wells TN1 2EB
| Today | See what it's worth now |
| 31 Mar 2026 | £202,500 |
| 11 Nov 2022 | £203,000 |
63, Albion Road, Tunbridge Wells TN1 2LD
| Today | See what it's worth now |
| 31 Mar 2026 | £285,000 |
| 9 Oct 2015 | £270,000 |
Extensions and planning permission in TN1
See planning approval stats, extension build costs and value added estimates.

Flat 9, 31 33, Mount Sion, Tunbridge Wells TN1 1TN
| Today | See what it's worth now |
| 31 Mar 2026 | £210,000 |
| 10 Mar 2017 | £180,000 |
148, St James Road, Tunbridge Wells TN1 2HE
| Today | See what it's worth now |
| 30 Mar 2026 | £434,420 |
| 13 Apr 2016 | £305,000 |
Garden Flat, 12c, Beulah Road, Royal Tunbridge Wells TN1 2NP
| Today | See what it's worth now |
| 23 Mar 2026 | £283,000 |
| 27 May 2022 | £262,000 |
Flat 10, Garden House, Calverley Street, Tunbridge Wells TN1 2XN
| Today | See what it's worth now |
| 20 Mar 2026 | £230,000 |
| 5 Apr 2005 | £190,000 |
No other historical records.
10, Mansion House Mews, Grove Hill Road, Tunbridge Wells TN1 1SX
| Today | See what it's worth now |
| 20 Mar 2026 | £248,000 |
| 5 Jul 2006 | £172,000 |
3, Tunnel Road, Tunbridge Wells TN1 2BT
| Today | See what it's worth now |
| 20 Mar 2026 | £753,572 |
| 16 Sep 2020 | £680,000 |
14, Stratford Street, Tunbridge Wells TN1 2JH
| Today | See what it's worth now |
| 19 Mar 2026 | £475,000 |
| 13 Dec 2019 | £400,000 |
31c, Upper Grosvenor Road, Tunbridge Wells TN1 2DX
| Today | See what it's worth now |
| 16 Mar 2026 | £250,000 |
| 24 Oct 2014 | £205,000 |
13, Stratford Street, Tunbridge Wells TN1 2JH
| Today | See what it's worth now |
| 12 Mar 2026 | £650,000 |
| 26 Jan 2022 | £441,000 |
Flat 4, 198, Upper Grosvenor Road, Tunbridge Wells TN1 2EH
| Today | See what it's worth now |
| 10 Mar 2026 | £291,000 |
| 17 Dec 2018 | £230,000 |
52a, St James Park, Royal Tunbridge Wells TN1 2LJ
| Today | See what it's worth now |
| 9 Mar 2026 | £911,000 |
No other historical records.
26, Dukes Road, Tunbridge Wells TN1 2PA
| Today | See what it's worth now |
| 6 Mar 2026 | £538,000 |
| 30 Jul 2020 | £481,000 |
20, Cumberland Walk, Tunbridge Wells TN1 1UJ
| Today | See what it's worth now |
| 2 Mar 2026 | £2,250,000 |
| 10 Mar 2004 | £1,100,000 |
23, Stone Street, Tunbridge Wells TN1 2QU
| Today | See what it's worth now |
| 2 Mar 2026 | £358,300 |
| 5 Aug 2016 | £267,000 |
56b, York Road, Tunbridge Wells TN1 1JY

| Today | See what it's worth now |
| 23 Feb 2026 | £216,000 |
| 12 Nov 2021 | £197,000 |
Flat 15, Garden House, Calverley Street, Tunbridge Wells TN1 2XN
| Today | See what it's worth now |
| 20 Feb 2026 | £460,000 |
| 4 Dec 2020 | £460,000 |
100, St James Road, Tunbridge Wells TN1 2HH
| Today | See what it's worth now |
| 17 Feb 2026 | £600,000 |
| 21 Jul 2022 | £560,000 |
7, Rose Hill House, Clarence Road, Tunbridge Wells TN1 1HB
| Today | See what it's worth now |
| 16 Feb 2026 | £470,000 |
| 11 Sep 2006 | £290,000 |
7, Cumberland Mews, Tunbridge Wells TN1 1TU
| Today | See what it's worth now |
| 16 Feb 2026 | £750,000 |
| 30 Jan 2015 | £435,000 |
2, Stanley Cottages, Stanley Road, Tunbridge Wells TN1 2BA
| Today | See what it's worth now |
| 16 Feb 2026 | £290,000 |
| 31 Aug 2006 | £180,000 |
No other historical records.

Source Acknowledgement: © Crown copyright. England and Wales house price data is publicly available information produced by the HM Land Registry.This material was last updated on 9 July 2026. It covers the period from 1 January 1995 to 30 April 2026 and contains property transactions which have been registered during that period. Contains HM Land Registry data © Crown copyright and database right 2026. This data is licensed under the Open Government Licence v3.0.
Disclaimer: Rightmove.co.uk provides this HM Land Registry data "as is". The burden for fitness of the data relies completely with the user and is provided for informational purposes only. No warranty, express or implied, is given relating to the accuracy of content of the HM Land Registry data and Rightmove does not accept any liability for error or omission. If you have found an error with the data or need further information please contact HM Land Registry.
Permitted Use: Viewers of this Information are granted permission to access this Crown copyright material and to download it onto electronic, magnetic, optical or similar storage media provided that such activities are for private research, study or in-house use only. Any other use of the material requires the formal written permission of Land Registry which can be requested from us, and is subject to an additional licence and associated charge.
Rightmove takes no liability for your use of, or reliance on, Rightmove's Instant Valuation due to the limitations of our tracking tool listed here. Use of this tool is taken entirely at your own risk. All rights reserved.