
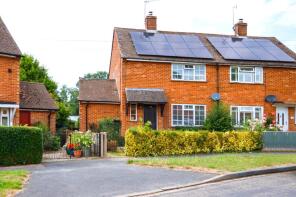
House Prices in TN8
House prices in TN8 have an overall average of £557,651 over the last year.
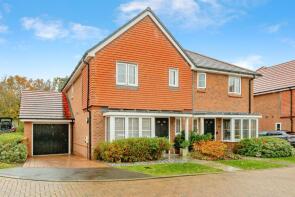
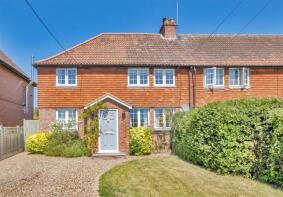
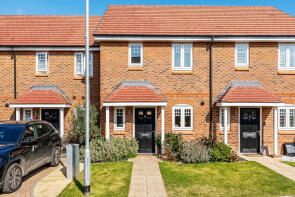
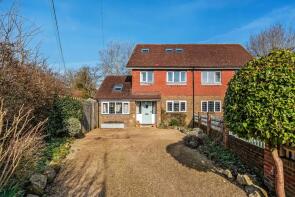
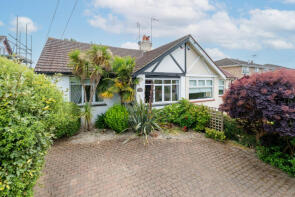
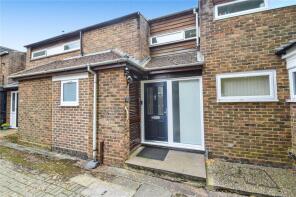
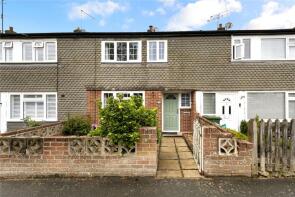
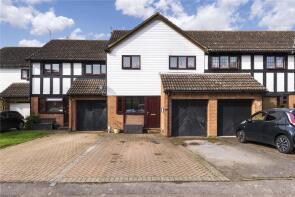
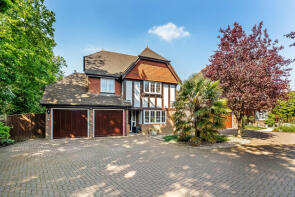
The majority of properties sold in TN8 during the last year were terraced properties, selling for an average price of £364,346. Semi-detached properties sold for an average of £507,891, with detached properties fetching £980,363.
Overall, the historical sold prices in TN8 over the last year were 1% up on the previous year and similar to the 2022 peak of £557,980.
Properties Sold
23, Cedar Drive, Edenbridge TN8 5JP
| Today | See what it's worth now |
| 16 Apr 2026 | £335,000 |
| 15 Jul 2003 | £145,950 |
11, Hawthorn Close, Edenbridge TN8 5JX

| Today | See what it's worth now |
| 9 Apr 2026 | £360,000 |
| 10 May 2021 | £234,000 |
No other historical records.
43, High Street, Edenbridge TN8 7JH
| Today | See what it's worth now |
| 1 Apr 2026 | £640,000 |
| 12 May 2005 | £249,950 |
Extensions and planning permission in TN8
See planning approval stats, extension build costs and value added estimates.

1, Woodpecker Close, Edenbridge TN8 6BS
| Today | See what it's worth now |
| 20 Mar 2026 | £320,000 |
| 6 Sep 2021 | £270,000 |
17, Cedar Drive, Edenbridge TN8 5JW
| Today | See what it's worth now |
| 20 Mar 2026 | £200,000 |
No other historical records.
30, Chantlers Mead, Edenbridge TN8 7HU
| Today | See what it's worth now |
| 18 Mar 2026 | £368,500 |
| 12 Jul 2022 | £405,000 |
No other historical records.
10, Hill Close, Edenbridge TN8 6EF
| Today | See what it's worth now |
| 16 Mar 2026 | £470,000 |
| 29 Jan 2020 | £429,995 |
No other historical records.
102, Lingfield Road, Edenbridge TN8 5EB
| Today | See what it's worth now |
| 12 Mar 2026 | £520,000 |
| 4 Dec 2012 | £250,000 |
14, Hailwood Drive, Edenbridge TN8 6FP
| Today | See what it's worth now |
| 6 Mar 2026 | £355,000 |
| 18 Dec 2020 | £335,000 |
No other historical records.
6, Riverside, Edenbridge TN8 5BH
| Today | See what it's worth now |
| 5 Mar 2026 | £110,000 |
No other historical records.
68, Hever Road, Edenbridge TN8 5DJ
| Today | See what it's worth now |
| 27 Feb 2026 | £280,000 |
| 13 Aug 2021 | £190,000 |
1b Little Millions, Victoria Road, Edenbridge TN8 5BS
| Today | See what it's worth now |
| 27 Feb 2026 | £255,000 |
| 6 Jul 2020 | £230,000 |
No other historical records.
1, Hop Cottage, Oakdale Lane, Edenbridge TN8 6RL
| Today | See what it's worth now |
| 27 Feb 2026 | £530,000 |
| 10 Mar 1995 | £130,000 |
No other historical records.
1, The Limes, Edenbridge TN8 5DT
| Today | See what it's worth now |
| 27 Feb 2026 | £357,500 |
| 14 Nov 2018 | £320,000 |
4, Haxted Place, Edenbridge TN8 6BF
| Today | See what it's worth now |
| 18 Feb 2026 | £530,000 |
| 21 Dec 2015 | £405,000 |
14, Church Street, Edenbridge TN8 5BD
| Today | See what it's worth now |
| 16 Feb 2026 | £263,500 |
| 11 Jun 2021 | £210,000 |
Spenceborough, Crouch House Road, Edenbridge TN8 5EE
| Today | See what it's worth now |
| 13 Feb 2026 | £635,000 |
No other historical records.
Yewtree Cottage, Rogers Town, Cowden, Holtye TN8 7EH
| Today | See what it's worth now |
| 4 Feb 2026 | £807,000 |
No other historical records.
3, The Mead, Priors Way, Edenbridge TN8 7HX
| Today | See what it's worth now |
| 4 Feb 2026 | £550,000 |
| 7 Mar 2018 | £465,000 |
Pilrig, Main Road, Edenbridge TN8 6JA
| Today | See what it's worth now |
| 30 Jan 2026 | £601,000 |
| 22 Feb 2008 | £367,500 |
No other historical records.
9, Hillcrest, Edenbridge TN8 6NH
| Today | See what it's worth now |
| 26 Jan 2026 | £412,000 |
| 14 Feb 2018 | £367,500 |
No other historical records.
10, Clover Walk, Edenbridge TN8 6DH
| Today | See what it's worth now |
| 23 Jan 2026 | £335,000 |
| 18 Apr 2017 | £250,000 |
No other historical records.
8, Chestnut Close, Edenbridge TN8 5JJ
| Today | See what it's worth now |
| 21 Jan 2026 | £375,000 |
| 3 Apr 2019 | £280,000 |
Source Acknowledgement: © Crown copyright. England and Wales house price data is publicly available information produced by the HM Land Registry.This material was last updated on 9 July 2026. It covers the period from 1 January 1995 to 30 April 2026 and contains property transactions which have been registered during that period. Contains HM Land Registry data © Crown copyright and database right 2026. This data is licensed under the Open Government Licence v3.0.
Disclaimer: Rightmove.co.uk provides this HM Land Registry data "as is". The burden for fitness of the data relies completely with the user and is provided for informational purposes only. No warranty, express or implied, is given relating to the accuracy of content of the HM Land Registry data and Rightmove does not accept any liability for error or omission. If you have found an error with the data or need further information please contact HM Land Registry.
Permitted Use: Viewers of this Information are granted permission to access this Crown copyright material and to download it onto electronic, magnetic, optical or similar storage media provided that such activities are for private research, study or in-house use only. Any other use of the material requires the formal written permission of Land Registry which can be requested from us, and is subject to an additional licence and associated charge.
Rightmove takes no liability for your use of, or reliance on, Rightmove's Instant Valuation due to the limitations of our tracking tool listed here. Use of this tool is taken entirely at your own risk. All rights reserved.