
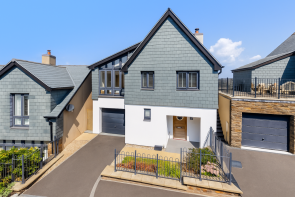
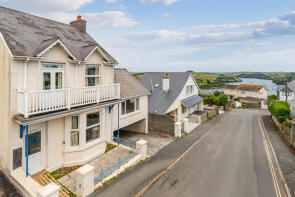
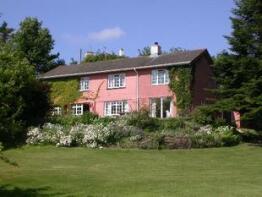
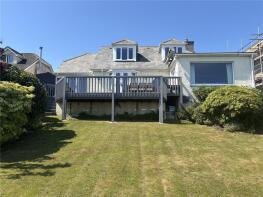
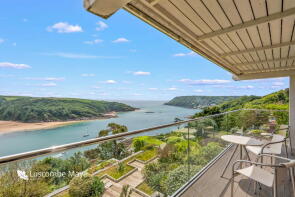
House Prices in TQ8
House prices in TQ8 have an overall average of £842,250 over the last year.
The majority of properties sold in TQ8 during the last year were detached properties, selling for an average price of £935,909. Flats sold for an average of £520,643, with terraced properties fetching £554,875.
Overall, the historical sold prices in TQ8 over the last year were 18% down on the previous year and 32% down on the 2022 peak of £1,239,378.
Properties Sold
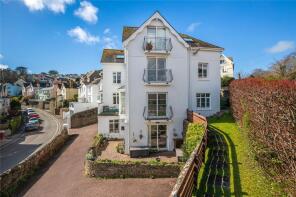
2, Orchard Drive, Salcombe TQ8 8FL
| Today | See what it's worth now |
| 21 Apr 2026 | £770,000 |
| 1 Sep 2016 | £672,000 |
No other historical records.
Moor Farm, East Portlemouth TQ8 8PW
| Today | See what it's worth now |
| 17 Feb 2026 | £460,000 |
No other historical records.
5, Moor Farm Cottages, Rickham Cross To Vinivers Cross, Salcombe TQ8 8PW
| Today | See what it's worth now |
| 22 Jan 2026 | £156,000 |
| 14 Apr 2022 | £159,000 |
Extensions and planning permission in TQ8
See planning approval stats, extension build costs and value added estimates.

Upper Flat, Bonne Vue, Bonaventure Road, Salcombe TQ8 8BE
| Today | See what it's worth now |
| 13 Jan 2026 | £395,000 |
| 20 Dec 1996 | £77,000 |
No other historical records.
Orchard House, Bonaventure Road, Salcombe TQ8 8BE

| Today | See what it's worth now |
| 13 Jan 2026 | £1,050,000 |
| 9 Dec 2021 | £1,400,000 |
No other historical records.
3 Bethel, Island Terrace, Salcombe TQ8 8DN
| Today | See what it's worth now |
| 18 Dec 2025 | £591,000 |
| 24 Nov 2017 | £472,500 |
25, Island Street, Salcombe TQ8 8DP
| Today | See what it's worth now |
| 9 Dec 2025 | £495,000 |
| 14 Aug 2015 | £315,000 |
Haifa, Main Road, Salcombe TQ8 8JW
| Today | See what it's worth now |
| 28 Nov 2025 | £450,000 |
| 27 Aug 2002 | £170,000 |
3, The Elms, Devon Road, Salcombe TQ8 8HE
| Today | See what it's worth now |
| 14 Nov 2025 | £340,000 |
| 22 Mar 2019 | £325,000 |
St Winnow, Kingsale Road, Salcombe TQ8 8AS

| Today | See what it's worth now |
| 28 Oct 2025 | £510,000 |
| 14 Jul 2023 | £815,000 |
28, Camperdown Road, Salcombe TQ8 8AX
| Today | See what it's worth now |
| 23 Oct 2025 | £285,000 |
| 17 May 2018 | £215,000 |
No other historical records.
Upper Deck Flat 3, Gardenhurst, Raleigh Road, Salcombe TQ8 8BH
| Today | See what it's worth now |
| 23 Oct 2025 | £322,500 |
| 16 Feb 2017 | £282,000 |
11 Shipwrights, Coronation Road, Salcombe TQ8 8EA
| Today | See what it's worth now |
| 10 Oct 2025 | £745,000 |
| 10 Jul 2006 | £425,000 |
Belgravia, Raleigh Road, Salcombe TQ8 8BH
| Today | See what it's worth now |
| 3 Oct 2025 | £595,000 |
| 3 Oct 2025 | £595,000 |
No other historical records.
The Willows, Horsecombe Cross To Batson Hill Along Zc320, Salcombe TQ8 8NF
| Today | See what it's worth now |
| 30 Sep 2025 | £1,350,000 |
| 15 Jan 2007 | £755,000 |
No other historical records.
Strathmore, Herbert Road, Salcombe TQ8 8HN
| Today | See what it's worth now |
| 25 Sep 2025 | £950,000 |
| 10 Nov 1999 | £290,000 |
3, Monkston Point, Devon Road, Salcombe TQ8 8LP
| Today | See what it's worth now |
| 19 Sep 2025 | £1,115,000 |
| 23 Nov 2006 | £695,000 |
No other historical records.
Fortescue, Anchor Watch, Cliff Road, Salcombe TQ8 8JU
| Today | See what it's worth now |
| 5 Aug 2025 | £725,000 |
No other historical records.
4, Croft View Terrace, Salcombe TQ8 8DL
| Today | See what it's worth now |
| 29 Jul 2025 | £694,500 |
| 12 Dec 2014 | £440,000 |
No other historical records.
Orchardside, Higher Batson TQ8 8NF
| Today | See what it's worth now |
| 25 Jul 2025 | £775,000 |
No other historical records.
9, Island Quay, Salcombe TQ8 8QD

| Today | See what it's worth now |
| 24 Jul 2025 | £1,750,000 |
| 15 Nov 1996 | £390,000 |
No other historical records.
Mew Stone East, Allenhayes Road, Salcombe TQ8 8HU
| Today | See what it's worth now |
| 17 Jul 2025 | £3,595,000 |
No other historical records.
The Sail Loft, Furzehill, Moult Road, Salcombe TQ8 8LG
| Today | See what it's worth now |
| 1 Jul 2025 | £1,500,000 |
No other historical records.

Source Acknowledgement: © Crown copyright. England and Wales house price data is publicly available information produced by the HM Land Registry.This material was last updated on 9 July 2026. It covers the period from 1 January 1995 to 30 April 2026 and contains property transactions which have been registered during that period. Contains HM Land Registry data © Crown copyright and database right 2026. This data is licensed under the Open Government Licence v3.0.
Disclaimer: Rightmove.co.uk provides this HM Land Registry data "as is". The burden for fitness of the data relies completely with the user and is provided for informational purposes only. No warranty, express or implied, is given relating to the accuracy of content of the HM Land Registry data and Rightmove does not accept any liability for error or omission. If you have found an error with the data or need further information please contact HM Land Registry.
Permitted Use: Viewers of this Information are granted permission to access this Crown copyright material and to download it onto electronic, magnetic, optical or similar storage media provided that such activities are for private research, study or in-house use only. Any other use of the material requires the formal written permission of Land Registry which can be requested from us, and is subject to an additional licence and associated charge.
Rightmove takes no liability for your use of, or reliance on, Rightmove's Instant Valuation due to the limitations of our tracking tool listed here. Use of this tool is taken entirely at your own risk. All rights reserved.