
House Prices in TS16
House prices in TS16 have an overall average of £248,659 over the last year.
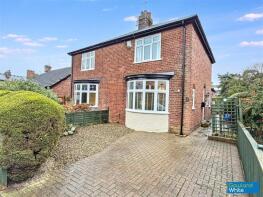
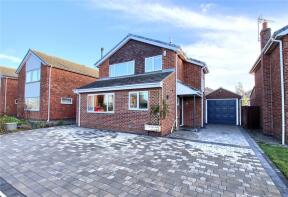
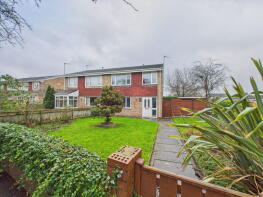
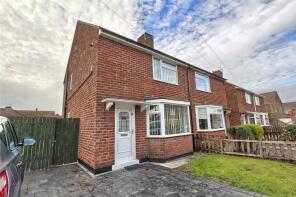
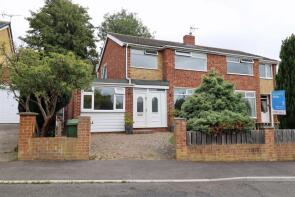
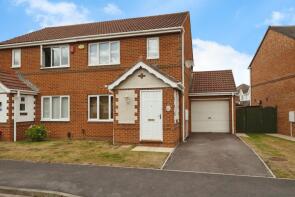
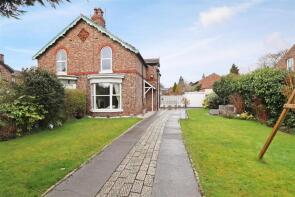
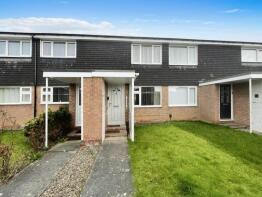
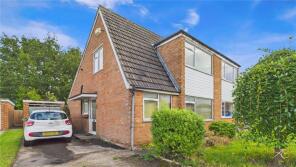
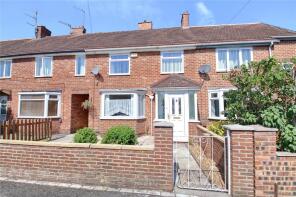
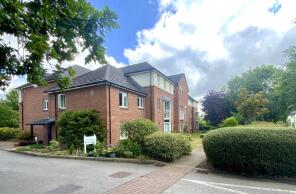
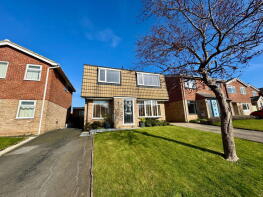
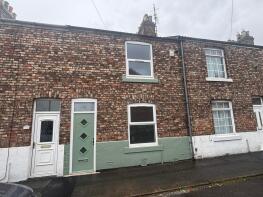
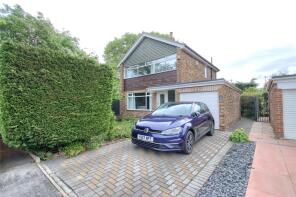
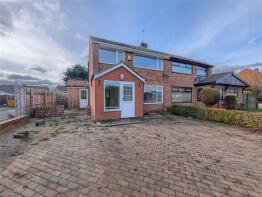
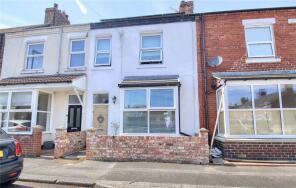
The majority of properties sold in TS16 during the last year were semi-detached properties, selling for an average price of £235,113. Detached properties sold for an average of £335,169, with terraced properties fetching £177,806.
Overall, the historical sold prices in TS16 over the last year were 11% down on the previous year and 11% down on the 2023 peak of £280,660.
Properties Sold
30, Croft Road, Eaglescliffe TS16 0DX
| Today | See what it's worth now |
| 27 Apr 2026 | £225,000 |
No other historical records.
9, Cromer Court, Stockton-on-tees TS16 9EF
| Today | See what it's worth now |
| 17 Apr 2026 | £325,000 |
| 13 Sep 2023 | £280,000 |
100, Meadowfield Drive, Stockton-on-tees TS16 0HJ
| Today | See what it's worth now |
| 8 Apr 2026 | £165,500 |
| 31 Aug 2017 | £130,000 |
No other historical records.
Extensions and planning permission in TS16
See planning approval stats, extension build costs and value added estimates.

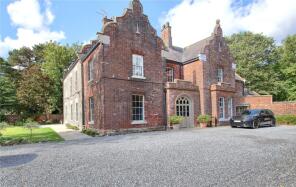
Nelson House, The Old Rectory, Butts Lane, Stockton-on-tees TS16 9BU
| Today | See what it's worth now |
| 31 Mar 2026 | £940,000 |
| 13 Apr 2012 | £650,000 |
No other historical records.
9, Lime Road, Stockton-on-tees TS16 0AX
| Today | See what it's worth now |
| 23 Mar 2026 | £130,000 |
| 31 Jul 1998 | £37,000 |
No other historical records.
12, Seymour Crescent, Stockton-on-tees TS16 0LF
| Today | See what it's worth now |
| 23 Mar 2026 | £202,500 |
| 4 Apr 2007 | £163,000 |
27, Royal George Drive, Stockton-on-tees TS16 0RU
| Today | See what it's worth now |
| 16 Mar 2026 | £191,500 |
| 22 May 2015 | £140,000 |
26, Monreith Avenue, Stockton-on-tees TS16 9HN
| Today | See what it's worth now |
| 5 Mar 2026 | £70,000 |
| 19 May 2006 | £75,000 |
6, Newsam Road, Stockton-on-tees TS16 0ED
| Today | See what it's worth now |
| 4 Mar 2026 | £308,000 |
| 9 Oct 2015 | £244,000 |
No other historical records.
27, Formby Walk, Stockton-on-tees TS16 9EL
| Today | See what it's worth now |
| 3 Mar 2026 | £70,090 |
| 30 Nov 2007 | £112,000 |
33, Grisedale Crescent, Egglescliffe TS16 9DS
| Today | See what it's worth now |
| 3 Mar 2026 | £205,000 |
No other historical records.
62, Myrtle Road, Stockton-on-tees TS16 0AR
| Today | See what it's worth now |
| 27 Feb 2026 | £150,000 |
| 3 May 2013 | £100,000 |
No other historical records.
3, Timothy Hackworth Court, The Avenue, Stockton-on-tees TS16 9AD
| Today | See what it's worth now |
| 19 Feb 2026 | £177,500 |
| 30 Jul 2018 | £200,000 |
8, Seymour Avenue, Stockton-on-tees TS16 0LD
| Today | See what it's worth now |
| 18 Feb 2026 | £290,000 |
| 15 Dec 2022 | £286,000 |
19, Myrtle Road, Stockton-on-tees TS16 0AL
| Today | See what it's worth now |
| 16 Feb 2026 | £142,000 |
| 8 Aug 2001 | £47,500 |
24, Thornfield Close, Stockton-on-tees TS16 0NW
| Today | See what it's worth now |
| 16 Feb 2026 | £268,550 |
| 10 Nov 2017 | £183,000 |
No other historical records.
20, Aberdovey Drive, Stockton-on-tees TS16 9EZ
| Today | See what it's worth now |
| 16 Feb 2026 | £213,000 |
| 31 Jan 2020 | £163,000 |
14, Royal George Drive, Stockton-on-tees TS16 0RU
| Today | See what it's worth now |
| 2 Feb 2026 | £200,000 |
| 18 Apr 2002 | £81,000 |
51, Royal George Drive, Stockton-on-tees TS16 0RU
| Today | See what it's worth now |
| 2 Feb 2026 | £210,000 |
| 14 Apr 2000 | £82,950 |
No other historical records.
12, Railway Terrace, Stockton-on-tees TS16 0BS

| Today | See what it's worth now |
| 28 Jan 2026 | £131,000 |
| 30 Nov 2020 | £103,000 |
27, Seymour Grove, Stockton-on-tees TS16 0LB
| Today | See what it's worth now |
| 23 Jan 2026 | £170,000 |
| 20 Jul 2018 | £134,000 |
16, Goosepool Drive, Stockton-on-tees TS16 0GT
| Today | See what it's worth now |
| 9 Jan 2026 | £212,000 |
| 26 Aug 2016 | £184,950 |
No other historical records.
1, Durham Lane, Stockton-on-tees TS16 0NA
| Today | See what it's worth now |
| 8 Jan 2026 | £215,000 |
| 31 Mar 2006 | £148,000 |

Source Acknowledgement: © Crown copyright. England and Wales house price data is publicly available information produced by the HM Land Registry.This material was last updated on 9 July 2026. It covers the period from 1 January 1995 to 30 April 2026 and contains property transactions which have been registered during that period. Contains HM Land Registry data © Crown copyright and database right 2026. This data is licensed under the Open Government Licence v3.0.
Disclaimer: Rightmove.co.uk provides this HM Land Registry data "as is". The burden for fitness of the data relies completely with the user and is provided for informational purposes only. No warranty, express or implied, is given relating to the accuracy of content of the HM Land Registry data and Rightmove does not accept any liability for error or omission. If you have found an error with the data or need further information please contact HM Land Registry.
Permitted Use: Viewers of this Information are granted permission to access this Crown copyright material and to download it onto electronic, magnetic, optical or similar storage media provided that such activities are for private research, study or in-house use only. Any other use of the material requires the formal written permission of Land Registry which can be requested from us, and is subject to an additional licence and associated charge.
Rightmove takes no liability for your use of, or reliance on, Rightmove's Instant Valuation due to the limitations of our tracking tool listed here. Use of this tool is taken entirely at your own risk. All rights reserved.