
House Prices in TW11
House prices in TW11 have an overall average of £781,668 over the last year.
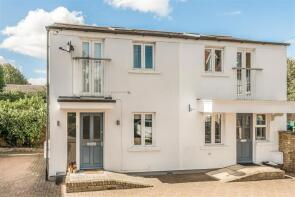
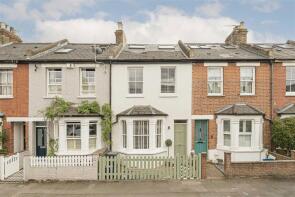
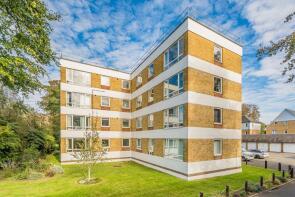
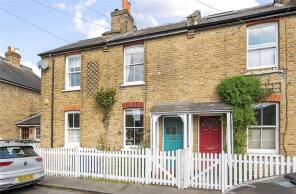
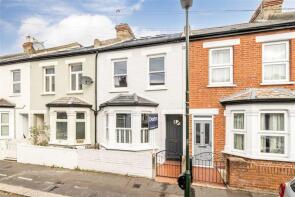
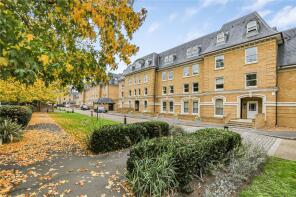
The majority of properties sold in TW11 during the last year were flats, selling for an average price of £433,360. Terraced properties sold for an average of £925,907, with semi-detached properties fetching £1,125,658.
Overall, the historical sold prices in TW11 over the last year were 10% down on the previous year and 12% down on the 2023 peak of £887,587.
Properties Sold
7, Trinder Mews, Teddington TW11 8HY
| Today | See what it's worth now |
| 15 Apr 2026 | £391,000 |
| 13 Nov 2015 | £395,000 |
32, Victor Road, Teddington TW11 8SR
| Today | See what it's worth now |
| 10 Apr 2026 | £920,000 |
| 27 Jun 2018 | £560,000 |
No other historical records.
38, Mays Road, Teddington TW11 0SQ
| Today | See what it's worth now |
| 7 Apr 2026 | £760,000 |
| 5 May 2022 | £690,000 |
No other historical records.
Extensions and planning permission in TW11
See planning approval stats, extension build costs and value added estimates.

54b, Broad Street, Teddington TW11 8QY
| Today | See what it's worth now |
| 31 Mar 2026 | £235,000 |
| 12 Dec 2022 | £249,000 |
21, Hampton Road, Teddington TW11 0JN
| Today | See what it's worth now |
| 25 Mar 2026 | £1,350,000 |
| 1 May 2007 | £765,000 |
No other historical records.
57, Connaught Road, Teddington TW11 0QF
| Today | See what it's worth now |
| 20 Mar 2026 | £832,000 |
| 8 Nov 2023 | £815,000 |
No other historical records.
1, Oxford Road, Teddington TW11 0QA
| Today | See what it's worth now |
| 20 Mar 2026 | £1,415,000 |
| 15 Oct 2014 | £1,000,000 |
Hurley House, Broom Road, Teddington TW11 9NP
| Today | See what it's worth now |
| 20 Mar 2026 | £815,000 |
| 17 Nov 2022 | £349,950 |
51, Wick Road, Teddington TW11 9DN

| Today | See what it's worth now |
| 20 Mar 2026 | £1,275,000 |
| 22 Mar 2021 | £1,087,500 |
17, Trematon Place, Teddington TW11 9RH
| Today | See what it's worth now |
| 20 Mar 2026 | £475,000 |
| 14 Oct 2002 | £249,950 |
22, Royal Road, Teddington TW11 0SB
| Today | See what it's worth now |
| 19 Mar 2026 | £550,000 |
| 14 Nov 2018 | £465,000 |
1, Rochester House, Fairfax Road, Teddington TW11 9DU
| Today | See what it's worth now |
| 17 Mar 2026 | £335,000 |
No other historical records.
23, School House Lane, Teddington TW11 9DP
| Today | See what it's worth now |
| 13 Mar 2026 | £742,450 |
| 30 Apr 1997 | £123,500 |
No other historical records.
14, Church Road, Teddington TW11 8PB
| Today | See what it's worth now |
| 12 Mar 2026 | £1,380,000 |
| 4 Jun 1999 | £249,950 |
Flat 15, 10 Braemar House, Manor Road, Teddington TW11 8BQ
| Today | See what it's worth now |
| 9 Mar 2026 | £385,000 |
| 30 Apr 1999 | £109,000 |
No other historical records.
15, Gomer Place, Teddington TW11 9AR
| Today | See what it's worth now |
| 6 Mar 2026 | £529,000 |
| 29 Apr 2013 | £352,000 |
Flat 1, 24, Hampton Road, Teddington TW11 0JW

| Today | See what it's worth now |
| 3 Mar 2026 | £500,000 |
| 16 Feb 2018 | £465,000 |
57, Stanley Gardens Road, Teddington TW11 8SY
| Today | See what it's worth now |
| 27 Feb 2026 | £910,000 |
| 26 Sep 2014 | £728,000 |
Flat 10, 5 Sycamore House, Langdon Park, Teddington TW11 9PE
| Today | See what it's worth now |
| 27 Feb 2026 | £550,000 |
| 16 Mar 2004 | £370,000 |
No other historical records.
Flat 4, 70b Courtyard Apartments, Hampton Road, Teddington TW11 0JF
| Today | See what it's worth now |
| 27 Feb 2026 | £320,000 |
| 17 Sep 2010 | £231,000 |
37, Victor Road, Teddington TW11 8SP

| Today | See what it's worth now |
| 25 Feb 2026 | £1,250,000 |
| 7 Aug 2015 | £700,000 |
No other historical records.
41, Clonmel Road, Teddington TW11 0ST
| Today | See what it's worth now |
| 23 Feb 2026 | £727,500 |
No other historical records.
24b, Udney Park Road, Teddington TW11 9BG
| Today | See what it's worth now |
| 20 Feb 2026 | £465,000 |
| 15 Jan 2003 | £250,000 |
Source Acknowledgement: © Crown copyright. England and Wales house price data is publicly available information produced by the HM Land Registry.This material was last updated on 9 July 2026. It covers the period from 1 January 1995 to 30 April 2026 and contains property transactions which have been registered during that period. Contains HM Land Registry data © Crown copyright and database right 2026. This data is licensed under the Open Government Licence v3.0.
Disclaimer: Rightmove.co.uk provides this HM Land Registry data "as is". The burden for fitness of the data relies completely with the user and is provided for informational purposes only. No warranty, express or implied, is given relating to the accuracy of content of the HM Land Registry data and Rightmove does not accept any liability for error or omission. If you have found an error with the data or need further information please contact HM Land Registry.
Permitted Use: Viewers of this Information are granted permission to access this Crown copyright material and to download it onto electronic, magnetic, optical or similar storage media provided that such activities are for private research, study or in-house use only. Any other use of the material requires the formal written permission of Land Registry which can be requested from us, and is subject to an additional licence and associated charge.
Rightmove takes no liability for your use of, or reliance on, Rightmove's Instant Valuation due to the limitations of our tracking tool listed here. Use of this tool is taken entirely at your own risk. All rights reserved.