
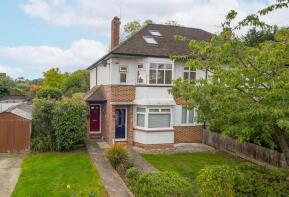
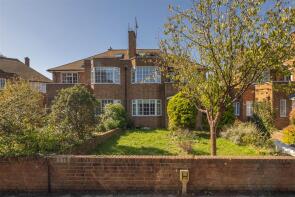
House Prices in The Clump
House prices in The Clump have an overall average of £850,872 over the last year.
The majority of properties sold in The Clump during the last year were terraced properties, selling for an average price of £749,241. Flats sold for an average of £401,733, with semi-detached properties fetching £1,033,188.
Overall, the historical sold prices in The Clump over the last year were similar to the previous year and similar to the 2022 peak of £858,371.
Properties Sold
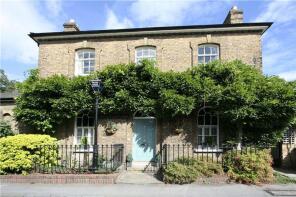
1, The Old Police Station, Ferry Road, Thames Ditton KT7 0XZ
| Today | See what it's worth now |
| 13 Apr 2026 | £415,000 |
| 30 Sep 2016 | £975,000 |
23, Harvest Lane, Thames Ditton KT7 0NG
| Today | See what it's worth now |
| 27 Mar 2026 | £870,000 |
| 10 May 2019 | £700,000 |
19, Portsmouth Road, Thames Ditton KT7 0SY
| Today | See what it's worth now |
| 26 Mar 2026 | £1,325,000 |
No other historical records.
56, Queens Road, Thames Ditton KT7 0QX
| Today | See what it's worth now |
| 20 Mar 2026 | £1,000,000 |
| 26 Oct 2018 | £840,000 |
32 Thames Cottage, Southbank, Thames Ditton KT7 0UD
| Today | See what it's worth now |
| 20 Mar 2026 | £600,000 |
| 20 May 2016 | £560,000 |
36, The Island, Thames Ditton KT7 0SQ
| Today | See what it's worth now |
| 19 Mar 2026 | £920,000 |
| 30 Sep 2021 | £890,000 |
Flat 11, Gresham House, Watts Road, Thames Ditton KT7 0BZ
| Today | See what it's worth now |
| 19 Mar 2026 | £460,000 |
| 30 Jun 2016 | £475,000 |
No other historical records.
2, St Leonards Court, Portsmouth Road, Thames Ditton KT7 0TG
| Today | See what it's worth now |
| 13 Mar 2026 | £262,500 |
| 3 Jan 2020 | £240,000 |
5, Warwick Road, Thames Ditton KT7 0PR
| Today | See what it's worth now |
| 9 Mar 2026 | £530,000 |
| 27 Jul 2018 | £490,000 |
104, Speer Road, Thames Ditton KT7 0PP
| Today | See what it's worth now |
| 6 Mar 2026 | £567,000 |
| 16 Oct 2002 | £165,000 |
No other historical records.
21, Linden Close, Thames Ditton KT7 0DG
| Today | See what it's worth now |
| 2 Mar 2026 | £440,000 |
| 30 Nov 2007 | £302,000 |
No other historical records.
17, Rythe Court, Portsmouth Road, Thames Ditton KT7 0TE
| Today | See what it's worth now |
| 26 Feb 2026 | £325,000 |
| 4 Oct 2001 | £140,000 |
No other historical records.
Flat 5, 42 Taggs House, Summer Road, Thames Ditton KT7 0QQ
| Today | See what it's worth now |
| 20 Feb 2026 | £652,000 |
| 25 May 2022 | £685,000 |
No other historical records.
Flat 13, 69 Twickenham Place, Woodfield Road, Thames Ditton KT7 0EF

| Today | See what it's worth now |
| 20 Feb 2026 | £320,000 |
| 28 Aug 2018 | £297,000 |
9, Aragon Avenue, Thames Ditton KT7 0PY
| Today | See what it's worth now |
| 18 Feb 2026 | £1,125,000 |
| 29 Sep 2015 | £805,000 |
32, Warwick Gardens, Thames Ditton KT7 0RB
| Today | See what it's worth now |
| 13 Feb 2026 | £400,000 |
| 24 Jul 2020 | £370,000 |
Flat 21, The Newlands, Weston Green Road, Thames Ditton KT7 0LA
| Today | See what it's worth now |
| 12 Feb 2026 | £195,000 |
| 20 May 2011 | £149,950 |
No other historical records.
Church Gate House, Church Walk, Thames Ditton KT7 0NN
| Today | See what it's worth now |
| 11 Feb 2026 | £1,955,000 |
No other historical records.
59, Lynwood Road, Thames Ditton KT7 0DJ
| Today | See what it's worth now |
| 6 Feb 2026 | £865,000 |
| 16 May 2008 | £550,000 |
17, Church Walk, Thames Ditton KT7 0NP
| Today | See what it's worth now |
| 6 Feb 2026 | £875,000 |
| 24 May 2019 | £800,000 |
23, Aragon Avenue, Thames Ditton KT7 0PY
| Today | See what it's worth now |
| 23 Jan 2026 | £1,120,000 |
| 23 Jul 1999 | £177,000 |
No other historical records.
19, Alexandra Road, Thames Ditton KT7 0QS
| Today | See what it's worth now |
| 22 Jan 2026 | £585,000 |
| 29 Jul 2013 | £413,000 |
Hingham House, Portsmouth Avenue, Thames Ditton KT7 0RU
| Today | See what it's worth now |
| 12 Jan 2026 | £1,025,000 |
| 13 May 2024 | £1,150,000 |
Source Acknowledgement: © Crown copyright. England and Wales house price data is publicly available information produced by the HM Land Registry.This material was last updated on 9 July 2026. It covers the period from 1 January 1995 to 30 April 2026 and contains property transactions which have been registered during that period. Contains HM Land Registry data © Crown copyright and database right 2026. This data is licensed under the Open Government Licence v3.0.
Disclaimer: Rightmove.co.uk provides this HM Land Registry data "as is". The burden for fitness of the data relies completely with the user and is provided for informational purposes only. No warranty, express or implied, is given relating to the accuracy of content of the HM Land Registry data and Rightmove does not accept any liability for error or omission. If you have found an error with the data or need further information please contact HM Land Registry.
Permitted Use: Viewers of this Information are granted permission to access this Crown copyright material and to download it onto electronic, magnetic, optical or similar storage media provided that such activities are for private research, study or in-house use only. Any other use of the material requires the formal written permission of Land Registry which can be requested from us, and is subject to an additional licence and associated charge.
Rightmove takes no liability for your use of, or reliance on, Rightmove's Instant Valuation due to the limitations of our tracking tool listed here. Use of this tool is taken entirely at your own risk. All rights reserved.