
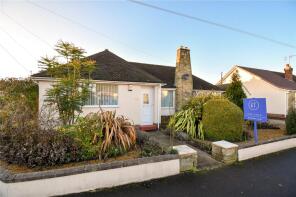
House Prices in Thingwall
House prices in Thingwall have an overall average of £294,748 over the last year.
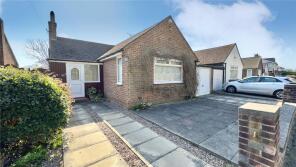
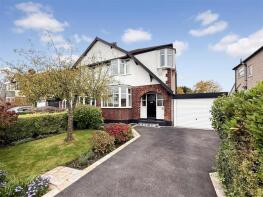
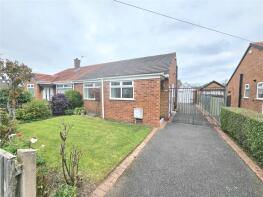
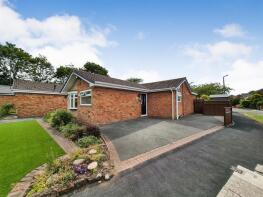
The majority of properties sold in Thingwall during the last year were semi-detached properties, selling for an average price of £277,357. Detached properties sold for an average of £424,682, with terraced properties fetching £215,000.
Overall, the historical sold prices in Thingwall over the last year were 6% up on the previous year and 6% up on the 2023 peak of £277,656.
Properties Sold
13, Torrington Drive, Wirral CH61 7UZ
| Today | See what it's worth now |
| 24 Apr 2026 | £125,000 |
| 21 Sep 2022 | £115,000 |
8, Hazeldene Avenue, Wirral CH61 7XX
| Today | See what it's worth now |
| 20 Apr 2026 | £245,000 |
| 12 Jul 2021 | £200,000 |
75, Cornelius Drive, Wirral CH61 9PZ
| Today | See what it's worth now |
| 10 Apr 2026 | £242,250 |
| 18 Sep 2019 | £173,500 |
No other historical records.
24, Gwendoline Close, Wirral CH61 1DL

| Today | See what it's worth now |
| 1 Apr 2026 | £276,000 |
| 29 Nov 2019 | £180,000 |
No other historical records.
30, Ambleside Close, Wirral CH61 3XQ
| Today | See what it's worth now |
| 30 Mar 2026 | £280,000 |
| 21 Jul 2017 | £190,000 |
14, Ambleside Close, Wirral CH61 3XG
| Today | See what it's worth now |
| 30 Mar 2026 | £300,000 |
| 21 Jan 2022 | £260,000 |
Top House Farm, Thingwall Road East, Wirral CH61 3UZ
| Today | See what it's worth now |
| 27 Mar 2026 | £287,000 |
| 15 Aug 2025 | £574,000 |
574 Thingwall House, Pensby Road, Wirral CH61 7UE
| Today | See what it's worth now |
| 26 Mar 2026 | £450,000 |
| 17 Nov 2020 | £385,000 |
42, Torrington Drive, Thingwall CH61 7UY
| Today | See what it's worth now |
| 20 Mar 2026 | £116,500 |
No other historical records.
24, Seven Acres Lane, Wirral CH61 7XY
| Today | See what it's worth now |
| 20 Mar 2026 | £468,000 |
| 13 Jan 2014 | £250,000 |
No other historical records.
21, Axholme Road, Wirral CH61 1BL
| Today | See what it's worth now |
| 27 Feb 2026 | £290,000 |
| 15 Oct 2021 | £242,000 |
80, Barnsdale Avenue, Wirral CH61 1BQ

| Today | See what it's worth now |
| 20 Feb 2026 | £321,000 |
| 13 Nov 2020 | £218,000 |
17, The Foxes, Wirral CH61 7YH
| Today | See what it's worth now |
| 17 Feb 2026 | £475,000 |
| 2 Oct 2017 | £375,000 |
457, Pensby Road, Wirral CH61 9PQ
| Today | See what it's worth now |
| 9 Feb 2026 | £219,000 |
| 5 Sep 2005 | £145,000 |
No other historical records.
61, Thingwall Road East, Wirral CH61 3UZ
| Today | See what it's worth now |
| 30 Jan 2026 | £250,000 |
| 12 Apr 2017 | £175,000 |
35, Thingwall Road East, Wirral CH61 3UY
| Today | See what it's worth now |
| 23 Jan 2026 | £281,000 |
| 30 Apr 1999 | £59,900 |
No other historical records.
65, Cornelius Drive, Irby CH61 9PZ
| Today | See what it's worth now |
| 19 Jan 2026 | £310,000 |
No other historical records.
114, Ridgemere Road, Wirral CH61 8RP
| Today | See what it's worth now |
| 16 Jan 2026 | £216,000 |
| 5 Sep 2014 | £147,500 |
3, Marlston Avenue, Irby CH61 3XT
| Today | See what it's worth now |
| 15 Jan 2026 | £273,000 |
No other historical records.
15, Sunningdale Drive, Wirral CH61 9PP

| Today | See what it's worth now |
| 16 Dec 2025 | £280,000 |
| 6 Sep 2002 | £135,000 |
20, Wimborne Avenue, Wirral CH61 7UL
| Today | See what it's worth now |
| 12 Dec 2025 | £325,000 |
| 5 Feb 2010 | £186,000 |
14, Anderson Close, Wirral CH61 3UU

| Today | See what it's worth now |
| 25 Nov 2025 | £200,000 |
| 6 Jul 2010 | £130,000 |
No other historical records.
Conwis Stables, Gallopers Lane, Wirral CH61 7YA
| Today | See what it's worth now |
| 21 Nov 2025 | £760,000 |
| 15 Nov 2019 | £600,000 |
Source Acknowledgement: © Crown copyright. England and Wales house price data is publicly available information produced by the HM Land Registry.This material was last updated on 9 July 2026. It covers the period from 1 January 1995 to 30 April 2026 and contains property transactions which have been registered during that period. Contains HM Land Registry data © Crown copyright and database right 2026. This data is licensed under the Open Government Licence v3.0.
Disclaimer: Rightmove.co.uk provides this HM Land Registry data "as is". The burden for fitness of the data relies completely with the user and is provided for informational purposes only. No warranty, express or implied, is given relating to the accuracy of content of the HM Land Registry data and Rightmove does not accept any liability for error or omission. If you have found an error with the data or need further information please contact HM Land Registry.
Permitted Use: Viewers of this Information are granted permission to access this Crown copyright material and to download it onto electronic, magnetic, optical or similar storage media provided that such activities are for private research, study or in-house use only. Any other use of the material requires the formal written permission of Land Registry which can be requested from us, and is subject to an additional licence and associated charge.
Rightmove takes no liability for your use of, or reliance on, Rightmove's Instant Valuation due to the limitations of our tracking tool listed here. Use of this tool is taken entirely at your own risk. All rights reserved.