
House Prices in Tonbridge
House prices in Tonbridge have an overall average of £491,524 over the last year.
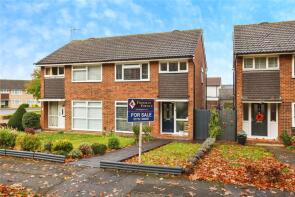
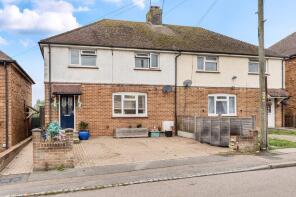
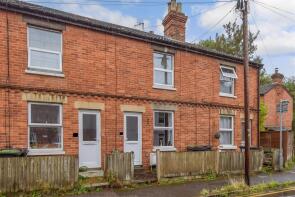
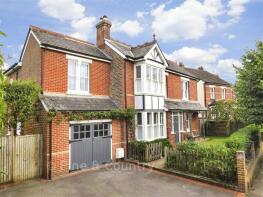
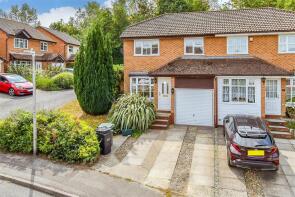
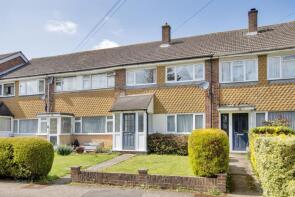
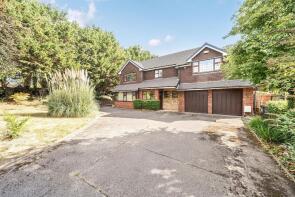
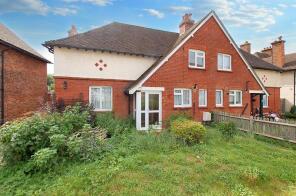
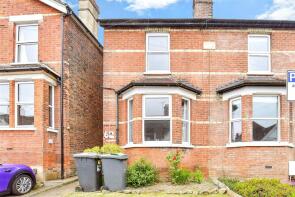
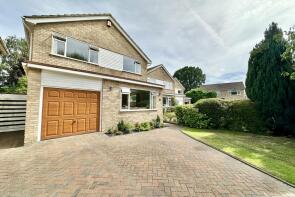
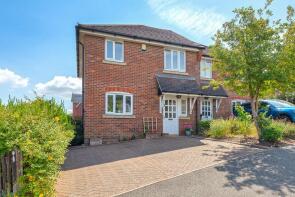
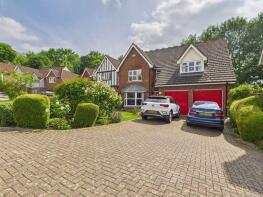
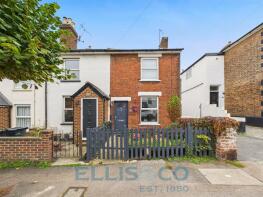
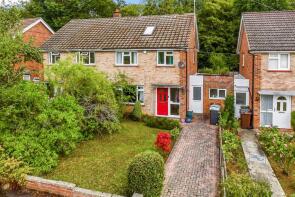
The majority of properties sold in Tonbridge during the last year were semi-detached properties, selling for an average price of £503,765. Detached properties sold for an average of £783,598, with terraced properties fetching £375,800.
Overall, the historical sold prices in Tonbridge over the last year were 4% up on the previous year and 8% up on the 2022 peak of £456,159.
Properties Sold
5, Swanland Drive, Tonbridge TN9 2RA
| Today | See what it's worth now |
| 24 Apr 2026 | £468,000 |
| 24 Mar 2016 | £308,100 |
42, The Chase, Tonbridge TN10 3HP
| Today | See what it's worth now |
| 8 Apr 2026 | £420,000 |
| 23 Feb 2018 | £335,000 |
160, Vale Road, Tonbridge TN9 1SP
| Today | See what it's worth now |
| 7 Apr 2026 | £275,000 |
| 8 Mar 2018 | £263,000 |
4, St Marys Road, Tonbridge TN9 2LD
| Today | See what it's worth now |
| 2 Apr 2026 | £1,110,000 |
| 20 Jan 2017 | £675,000 |
44, Hilltop, Tonbridge TN9 2UN
| Today | See what it's worth now |
| 31 Mar 2026 | £425,000 |
| 27 Sep 2013 | £290,000 |
41, Garden Road, Tonbridge TN9 1PT
| Today | See what it's worth now |
| 31 Mar 2026 | £400,000 |
| 28 Feb 2003 | £155,000 |
No other historical records.
1, Valley Forge Close, Tonbridge TN10 4EU
| Today | See what it's worth now |
| 30 Mar 2026 | £1,050,000 |
| 30 Jun 1995 | £235,000 |
No other historical records.
17 The Haven, Greenview Crescent, Hildenborough, Tonbridge TN11 9DR
| Today | See what it's worth now |
| 30 Mar 2026 | £850,000 |
| 23 Aug 2017 | £645,000 |
25, Clare Avenue, Tonbridge TN9 1XN
| Today | See what it's worth now |
| 27 Mar 2026 | £367,500 |
| 5 Dec 2007 | £150,000 |
No other historical records.
62, Hectorage Road, Tonbridge TN9 2DP
| Today | See what it's worth now |
| 27 Mar 2026 | £332,000 |
| 23 Apr 2019 | £275,500 |
No other historical records.
66, Avebury Avenue, Tonbridge TN9 1TQ

| Today | See what it's worth now |
| 27 Mar 2026 | £255,000 |
| 30 Nov 2004 | £195,000 |
13, Castle Field, The Slade, Tonbridge TN9 1HS
| Today | See what it's worth now |
| 27 Mar 2026 | £250,000 |
| 18 Feb 2019 | £245,000 |
54, Allington Drive, Tonbridge TN10 4HH
| Today | See what it's worth now |
| 27 Mar 2026 | £700,000 |
| 31 Jul 1998 | £173,000 |
No other historical records.
43, St Marys Road, Tonbridge TN9 2LE
| Today | See what it's worth now |
| 24 Mar 2026 | £463,000 |
| 21 Jun 2013 | £300,000 |
44, Shipbourne Road, Tonbridge TN10 3DS
| Today | See what it's worth now |
| 23 Mar 2026 | £620,000 |
No other historical records.
22, Castle Field, The Slade, Tonbridge TN9 1HS

| Today | See what it's worth now |
| 20 Mar 2026 | £180,000 |
| 15 Mar 2021 | £218,500 |
Flat 21, Waterway House, Medway Wharf Road, Tonbridge TN9 1AY
| Today | See what it's worth now |
| 20 Mar 2026 | £285,000 |
| 27 Aug 2010 | £220,000 |
No other historical records.
10, Amberley Close, Tonbridge TN9 2UH
| Today | See what it's worth now |
| 20 Mar 2026 | £445,000 |
| 21 Apr 1997 | £87,500 |
27, St Bernards Road, Tonbridge TN10 3NL
| Today | See what it's worth now |
| 20 Mar 2026 | £526,000 |
| 27 Jul 2012 | £329,000 |
1, Deakin Leas, Tonbridge TN9 2JS
| Today | See what it's worth now |
| 19 Mar 2026 | £430,000 |
| 19 Dec 2019 | £355,000 |
27, Quarry Bank, Tonbridge TN9 2QZ
| Today | See what it's worth now |
| 19 Mar 2026 | £930,000 |
| 27 Mar 1997 | £235,000 |
No other historical records.
10, Chaucer Gardens, Tonbridge TN9 2QA

| Today | See what it's worth now |
| 18 Mar 2026 | £450,000 |
| 28 Aug 2020 | £350,000 |
67, Lavender Hill, Tonbridge TN9 2AX
| Today | See what it's worth now |
| 13 Mar 2026 | £421,500 |
| 20 Jan 2023 | £363,000 |
No other historical records.
Source Acknowledgement: © Crown copyright. England and Wales house price data is publicly available information produced by the HM Land Registry.This material was last updated on 9 July 2026. It covers the period from 1 January 1995 to 30 April 2026 and contains property transactions which have been registered during that period. Contains HM Land Registry data © Crown copyright and database right 2026. This data is licensed under the Open Government Licence v3.0.
Disclaimer: Rightmove.co.uk provides this HM Land Registry data "as is". The burden for fitness of the data relies completely with the user and is provided for informational purposes only. No warranty, express or implied, is given relating to the accuracy of content of the HM Land Registry data and Rightmove does not accept any liability for error or omission. If you have found an error with the data or need further information please contact HM Land Registry.
Permitted Use: Viewers of this Information are granted permission to access this Crown copyright material and to download it onto electronic, magnetic, optical or similar storage media provided that such activities are for private research, study or in-house use only. Any other use of the material requires the formal written permission of Land Registry which can be requested from us, and is subject to an additional licence and associated charge.
Rightmove takes no liability for your use of, or reliance on, Rightmove's Instant Valuation due to the limitations of our tracking tool listed here. Use of this tool is taken entirely at your own risk. All rights reserved.