
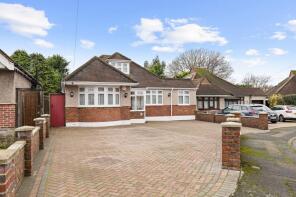
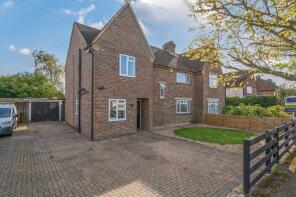
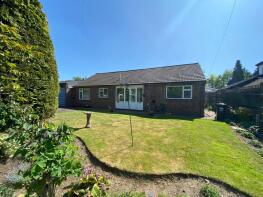
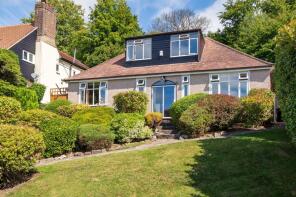
House Prices in Warlingham
House prices in Warlingham have an overall average of £536,594 over the last year.
The majority of properties sold in Warlingham during the last year were detached properties, selling for an average price of £853,071. Flats sold for an average of £264,795, with semi-detached properties fetching £513,419.
Overall, the historical sold prices in Warlingham over the last year were similar to the previous year and 6% down on the 2022 peak of £572,014.
Properties Sold
4, Princes Close, South Croydon CR2 9BP
| Today | See what it's worth now |
| 10 Apr 2026 | £595,000 |
| 28 Nov 2003 | £249,950 |
16, Crewes Avenue, Warlingham CR6 9NY
| Today | See what it's worth now |
| 2 Apr 2026 | £650,000 |
| 23 Oct 2009 | £277,000 |
16, Eglise Road, Warlingham CR6 9SE
| Today | See what it's worth now |
| 2 Apr 2026 | £590,000 |
| 16 Mar 2001 | £283,950 |
No other historical records.
19, Stuart Road, Warlingham CR6 9JH
| Today | See what it's worth now |
| 30 Mar 2026 | £675,000 |
| 23 Sep 2002 | £295,000 |
No other historical records.
127, Harewood Gardens, South Croydon CR2 9BW
| Today | See what it's worth now |
| 30 Mar 2026 | £520,000 |
| 26 Jul 2019 | £410,000 |
No other historical records.
17, Alpha Court, Hillside Road, Whyteleafe CR3 0BU

| Today | See what it's worth now |
| 30 Mar 2026 | £252,500 |
No other historical records.
5, Fern Close, Warlingham CR6 9SQ
| Today | See what it's worth now |
| 27 Mar 2026 | £478,250 |
No other historical records.
115, Hillside Road, Whyteleafe CR3 0BS
| Today | See what it's worth now |
| 27 Mar 2026 | £250,000 |
| 18 Dec 2020 | £272,500 |
6, Lime Grove, Warlingham CR6 9DB
| Today | See what it's worth now |
| 25 Mar 2026 | £310,000 |
| 19 Mar 2018 | £310,000 |
No other historical records.
452, Limpsfield Road, Warlingham CR6 9LG

| Today | See what it's worth now |
| 16 Mar 2026 | £565,000 |
| 28 Mar 2018 | £417,500 |
22, Blanchmans Road, Warlingham CR6 9DE

| Today | See what it's worth now |
| 11 Mar 2026 | £585,000 |
| 2 Jul 2001 | £166,000 |
No other historical records.
23, 545 Harewood Court, Limpsfield Road, Warlingham CR6 9DX
| Today | See what it's worth now |
| 10 Mar 2026 | £157,500 |
| 30 Sep 2015 | £175,000 |
33, Glebe Road, Warlingham CR6 9NG
| Today | See what it's worth now |
| 6 Mar 2026 | £506,000 |
| 3 Dec 2007 | £285,000 |
16, Treetops, Hillside Road, Whyteleafe CR3 0BY
| Today | See what it's worth now |
| 27 Feb 2026 | £238,000 |
| 30 Nov 2005 | £143,500 |
5, Birch Way, Warlingham CR6 9DA
| Today | See what it's worth now |
| 27 Feb 2026 | £815,000 |
| 10 Dec 2020 | £730,000 |
1a Edgeworth, Oakley Road, Warlingham CR6 9BE
| Today | See what it's worth now |
| 26 Feb 2026 | £1,457,500 |
| 22 Sep 2008 | £849,000 |
1, Hawthorn Close, Warlingham CR6 9AZ
| Today | See what it's worth now |
| 25 Feb 2026 | £285,000 |
| 11 May 2024 | £240,000 |
No other historical records.
303, Godstone Road, Whyteleafe CR3 0BD
| Today | See what it's worth now |
| 24 Feb 2026 | £440,000 |
| 30 Mar 2021 | £412,000 |
2, Albert Road, Warlingham CR6 9EP
| Today | See what it's worth now |
| 23 Feb 2026 | £360,000 |
No other historical records.
15, Crowborough Drive, Warlingham CR6 9SJ
| Today | See what it's worth now |
| 3 Feb 2026 | £525,000 |
| 8 Aug 1996 | £113,500 |
No other historical records.
121, Limpsfield Road, Warlingham CR6 9RH

| Today | See what it's worth now |
| 30 Jan 2026 | £275,000 |
| 15 Oct 2018 | £205,000 |
74, Shelton Avenue, Warlingham CR6 9NE
| Today | See what it's worth now |
| 30 Jan 2026 | £650,000 |
| 21 Dec 2020 | £587,000 |
5, Escomb Court, Godstone Road, Whyteleafe CR3 0GH
| Today | See what it's worth now |
| 30 Jan 2026 | £110,000 |
| 18 Dec 2020 | £115,500 |
Source Acknowledgement: © Crown copyright. England and Wales house price data is publicly available information produced by the HM Land Registry.This material was last updated on 9 July 2026. It covers the period from 1 January 1995 to 30 April 2026 and contains property transactions which have been registered during that period. Contains HM Land Registry data © Crown copyright and database right 2026. This data is licensed under the Open Government Licence v3.0.
Disclaimer: Rightmove.co.uk provides this HM Land Registry data "as is". The burden for fitness of the data relies completely with the user and is provided for informational purposes only. No warranty, express or implied, is given relating to the accuracy of content of the HM Land Registry data and Rightmove does not accept any liability for error or omission. If you have found an error with the data or need further information please contact HM Land Registry.
Permitted Use: Viewers of this Information are granted permission to access this Crown copyright material and to download it onto electronic, magnetic, optical or similar storage media provided that such activities are for private research, study or in-house use only. Any other use of the material requires the formal written permission of Land Registry which can be requested from us, and is subject to an additional licence and associated charge.
Rightmove takes no liability for your use of, or reliance on, Rightmove's Instant Valuation due to the limitations of our tracking tool listed here. Use of this tool is taken entirely at your own risk. All rights reserved.