
House Prices in Ansley
House prices in Ansley have an overall average of £276,486 over the last year.
The majority of properties sold in Ansley during the last year were semi-detached properties, selling for an average price of £272,427. Detached properties sold for an average of £339,900, with terraced properties fetching £196,250.
Overall, the historical sold prices in Ansley over the last year were 4% up on the previous year and 6% down on the 2022 peak of £292,774.
Properties Sold
8, St Lawrence Road, Nuneaton CV10 9PN
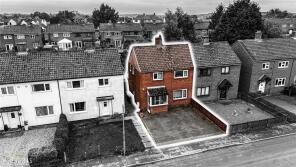
| Today | See today's value |
| 31 Jul 2026 | £200,000 |
| 21 Oct 2016 | £118,000 |
136, Birmingham Road, Ansley CV10 9PL
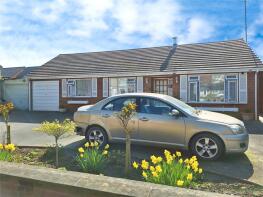
| Today | See today's value |
| 20 Jul 2026 | £329,500 |
No other historical records.
73, Ribbon Avenue, Nuneaton CV10 9TJ

| Today | See today's value |
| 1 Jul 2026 | £325,000 |
| 1 Sep 2021 | £306,995 |
No other historical records.
182, Birmingham Road, Ansley CV10 9PG
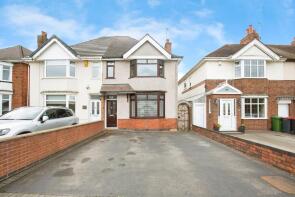
| Today | See today's value |
| 26 Jun 2026 | £306,250 |
| 20 Sep 2024 | £289,000 |
No other historical records.
54, Nuthurst Crescent, Nuneaton CV10 9PJ

| Today | See today's value |
| 8 May 2026 | £290,000 |
| 28 Aug 2020 | £227,500 |
42, Galley View, Nuneaton CV10 9GT

| Today | See today's value |
| 5 May 2026 | £275,000 |
| 31 Jul 2020 | £239,950 |
No other historical records.
70, Ribbon Avenue, Nuneaton CV10 9TL

| Today | See today's value |
| 10 Apr 2026 | £258,000 |
| 19 Nov 2021 | £255,600 |
No other historical records.
82, Ribbon Avenue, Nuneaton CV10 9TL
| Today | See today's value |
| 10 Apr 2026 | £248,000 |
| 25 Mar 2022 | £255,600 |
No other historical records.
7, Nuthurst Crescent, Nuneaton CV10 9PJ

| Today | See today's value |
| 27 Mar 2026 | £237,500 |
| 13 Oct 2023 | £200,000 |
No other historical records.
14, Birmingham Road, Nuneaton CV10 9PS

| Today | See today's value |
| 18 Feb 2026 | £480,000 |
| 9 Dec 2016 | £365,000 |
No other historical records.
1, Well Cottages, Coleshill Road, Nuneaton CV10 0QP

| Today | See today's value |
| 13 Feb 2026 | £550,000 |
| 25 Oct 2011 | £200,000 |
No other historical records.
53, Birmingham Road, Nuneaton CV10 9PS

| Today | See today's value |
| 30 Jan 2026 | £200,000 |
| 3 Jun 2010 | £122,000 |
No other historical records.
16, Ribbon Avenue, Ansley CV10 9TL

| Today | See today's value |
| 23 Jan 2026 | £120,000 |
| 4 Sep 2024 | £120,000 |
No other historical records.
72, Birmingham Road, Nuneaton CV10 9PS

| Today | See today's value |
| 16 Jan 2026 | £190,000 |
| 16 May 2018 | £132,000 |
The Dairy, Ansley Hall, Coleshill Road, Ansley Common, Ansley CV10 0QG

| Today | See today's value |
| 16 Jan 2026 | £299,950 |
| 21 May 2021 | £225,000 |
4, Miners Croft, Nuneaton CV10 9TN

| Today | See today's value |
| 16 Jan 2026 | £287,000 |
| 17 Nov 2020 | £254,995 |
No other historical records.
20, Galley View, Nuneaton CV10 9GT

| Today | See today's value |
| 9 Jan 2026 | £290,000 |
| 22 Nov 2019 | £234,950 |
No other historical records.
29, Birmingham Road, Nuneaton CV10 9PS
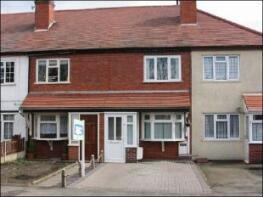
| Today | See today's value |
| 17 Nov 2025 | £190,000 |
| 18 Dec 2006 | £115,000 |
4, Ansley Hall, Coleshill Road, Nuneaton CV10 0QG
| Today | See today's value |
| 13 Nov 2025 | £325,000 |
| 18 Feb 2005 | £195,000 |
135, Birmingham Road, Nuneaton CV10 9PL

| Today | See today's value |
| 12 Nov 2025 | £205,000 |
| 23 Nov 2023 | £199,950 |
3, Malthouse Close, Nuneaton CV10 9PR

| Today | See today's value |
| 20 Oct 2025 | £200,000 |
| 9 Sep 2016 | £135,000 |
36, Ribbon Avenue, Nuneaton CV10 9TL

| Today | See today's value |
| 12 Sep 2025 | £395,000 |
| 31 Mar 2021 | £355,995 |
No other historical records.
417, Tunnel Road, Nuneaton CV10 9PF

| Today | See today's value |
| 21 Aug 2025 | £188,000 |
| 1 Jul 2014 | £104,000 |

Rightmove takes no liability for your use of, or reliance on, Rightmove's Instant Valuation due to the limitations of our tracking tool listed here. Use of this tool is taken entirely at your own risk. All rights reserved.