
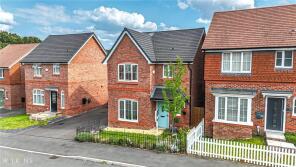
House Prices in Galley Common
House prices in Galley Common have an overall average of £283,794 over the last year.
The majority of properties sold in Galley Common during the last year were detached properties, selling for an average price of £327,375. Semi-detached properties sold for an average of £214,354, with terraced properties fetching £210,000.
Overall, the historical sold prices in Galley Common over the last year were 7% up on the previous year and 2% down on the 2023 peak of £290,914.
Properties Sold
62, Polar Avenue, Nuneaton CV10 9SX
| Today | See what it's worth now |
| 2 Apr 2026 | £380,000 |
| 13 May 2022 | £344,995 |
No other historical records.
13, Buchan Close, Nuneaton CV10 9RR
| Today | See what it's worth now |
| 27 Mar 2026 | £377,000 |
| 6 Dec 2021 | £320,000 |
6, Nubian Way, Nuneaton CV10 9QZ
| Today | See what it's worth now |
| 12 Mar 2026 | £380,000 |
| 3 Sep 2021 | £354,995 |
No other historical records.
4, Auden Close, Nuneaton CV10 9RP
| Today | See what it's worth now |
| 11 Mar 2026 | £142,500 |
| 27 Mar 1997 | £40,500 |
No other historical records.
1, Crackenthorpe Way, Nuneaton CV10 9TS
| Today | See what it's worth now |
| 26 Feb 2026 | £375,000 |
| 12 Feb 2021 | £305,995 |
No other historical records.
12, Orwell Close, Nuneaton CV10 9RL
| Today | See what it's worth now |
| 17 Feb 2026 | £322,500 |
| 18 Jun 2021 | £170,000 |
37, Adelie Road, Nuneaton CV10 9GZ
| Today | See what it's worth now |
| 13 Feb 2026 | £390,000 |
| 31 Mar 2021 | £354,995 |
No other historical records.
43, Polar Avenue, Nuneaton CV10 9SX
| Today | See what it's worth now |
| 2 Feb 2026 | £343,000 |
| 18 Mar 2022 | £339,995 |
No other historical records.
57, Polar Avenue, Nuneaton CV10 9SX
| Today | See what it's worth now |
| 23 Jan 2026 | £335,000 |
| 30 Jun 2022 | £305,995 |
No other historical records.
21, Bretts Hall Estate, Ansley Common CV10 0PN
| Today | See what it's worth now |
| 19 Dec 2025 | £222,000 |
No other historical records.
97, Orford Rise, Nuneaton CV10 9SA
| Today | See what it's worth now |
| 18 Dec 2025 | £210,000 |
| 20 Jul 2016 | £136,000 |
3, Adelie Road, Nuneaton CV10 9GZ

| Today | See what it's worth now |
| 15 Dec 2025 | £337,500 |
| 18 Dec 2020 | £289,995 |
No other historical records.
49, Hickman Road, Galley Common, Nuneaton CV10 9NG
| Today | See what it's worth now |
| 12 Dec 2025 | £259,000 |
No other historical records.
18, Dickens Close, Nuneaton CV10 9SQ
| Today | See what it's worth now |
| 4 Dec 2025 | £320,000 |
| 23 Sep 2021 | £299,950 |
No other historical records.
25, Hickman Road, Nuneaton CV10 9NQ
| Today | See what it's worth now |
| 28 Nov 2025 | £258,000 |
| 22 Jan 2021 | £195,000 |
13, Keats Close, Nuneaton CV10 9RG

| Today | See what it's worth now |
| 28 Nov 2025 | £350,000 |
| 14 Feb 1997 | £63,000 |
No other historical records.
11, Ruskin Close, Nuneaton CV10 9RU
| Today | See what it's worth now |
| 7 Nov 2025 | £205,500 |
| 31 Mar 2017 | £138,500 |
9, Crackenthorpe Way, Nuneaton CV10 9TS
| Today | See what it's worth now |
| 31 Oct 2025 | £300,000 |
| 5 Mar 2021 | £254,950 |
No other historical records.
3, Ruskin Close, Galley Common, Nuneaton CV10 9RU
| Today | See what it's worth now |
| 28 Oct 2025 | £360,000 |
No other historical records.
20, Buchan Close, Nuneaton CV10 9RR
| Today | See what it's worth now |
| 17 Oct 2025 | £355,000 |
| 8 Oct 2004 | £185,000 |
27, Middlefield Lane, Nuneaton CV10 9RF
| Today | See what it's worth now |
| 17 Oct 2025 | £280,000 |
| 25 Jan 2019 | £229,995 |
No other historical records.
95, Plough Hill Road, Nuneaton CV10 9NY
| Today | See what it's worth now |
| 17 Oct 2025 | £238,500 |
| 22 Nov 1995 | £46,000 |
No other historical records.
15, Adelie Road, Nuneaton CV10 9GZ
| Today | See what it's worth now |
| 17 Oct 2025 | £290,000 |
| 11 Nov 2022 | £284,995 |
No other historical records.
Source Acknowledgement: © Crown copyright. England and Wales house price data is publicly available information produced by the HM Land Registry.This material was last updated on 9 July 2026. It covers the period from 1 January 1995 to 30 April 2026 and contains property transactions which have been registered during that period. Contains HM Land Registry data © Crown copyright and database right 2026. This data is licensed under the Open Government Licence v3.0.
Disclaimer: Rightmove.co.uk provides this HM Land Registry data "as is". The burden for fitness of the data relies completely with the user and is provided for informational purposes only. No warranty, express or implied, is given relating to the accuracy of content of the HM Land Registry data and Rightmove does not accept any liability for error or omission. If you have found an error with the data or need further information please contact HM Land Registry.
Permitted Use: Viewers of this Information are granted permission to access this Crown copyright material and to download it onto electronic, magnetic, optical or similar storage media provided that such activities are for private research, study or in-house use only. Any other use of the material requires the formal written permission of Land Registry which can be requested from us, and is subject to an additional licence and associated charge.
Rightmove takes no liability for your use of, or reliance on, Rightmove's Instant Valuation due to the limitations of our tracking tool listed here. Use of this tool is taken entirely at your own risk. All rights reserved.