
House Prices in B64
House prices in B64 have an overall average of £234,592 over the last year.
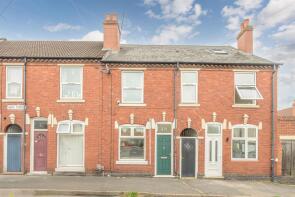
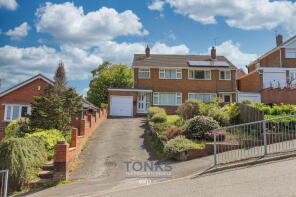
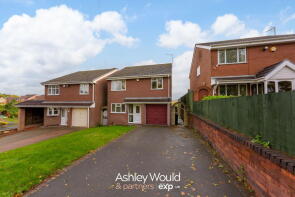
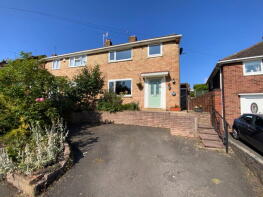
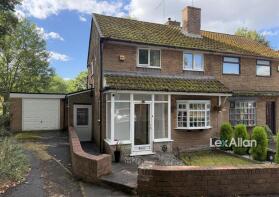
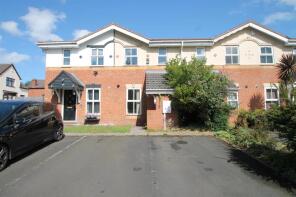
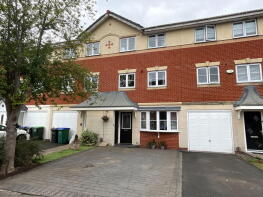
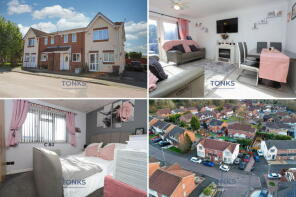
The majority of properties sold in B64 during the last year were semi-detached properties, selling for an average price of £228,795. Terraced properties sold for an average of £205,215, with detached properties fetching £327,101.
Overall, the historical sold prices in B64 over the last year were 3% up on the previous year and 11% up on the 2023 peak of £211,626.
Properties Sold
10, Millennium Gardens, Cradley Heath B64 5LL
| Today | See what it's worth now |
| 15 Apr 2026 | £218,000 |
| 23 Jun 2006 | £127,000 |
48, Petford Street, Cradley Heath B64 6DZ
| Today | See what it's worth now |
| 1 Apr 2026 | £200,000 |
| 28 Feb 2025 | £195,000 |
17, Graingers Lane, Cradley Heath B64 6AH
| Today | See what it's worth now |
| 27 Mar 2026 | £187,000 |
| 14 Jul 2017 | £124,950 |
No other historical records.
Extensions and planning permission in B64
See planning approval stats, extension build costs and value added estimates.

3, Hayseech, Cradley Heath B64 7JL
| Today | See what it's worth now |
| 19 Mar 2026 | £286,000 |
| 24 Aug 2001 | £87,000 |
2, Whitehall Road, Cradley Heath B64 5BG
| Today | See what it's worth now |
| 17 Mar 2026 | £189,000 |
No other historical records.
33, Haden Park Road, Cradley Heath B64 7HF
| Today | See what it's worth now |
| 13 Mar 2026 | £395,000 |
| 23 Aug 2024 | £373,000 |
137, Wrights Lane, Cradley Heath B64 6RH
| Today | See what it's worth now |
| 2 Mar 2026 | £235,000 |
| 14 Jul 2023 | £230,000 |
12, Hingley Court, Hill Passage, Cradley Heath B64 6HB
| Today | See what it's worth now |
| 20 Feb 2026 | £115,000 |
| 14 Jun 2024 | £115,000 |
36, Highgate Street, Cradley Heath B64 5RY
| Today | See what it's worth now |
| 20 Feb 2026 | £178,000 |
| 9 May 2002 | £46,000 |
No other historical records.
120, Wrights Lane, Cradley Heath B64 6RH

| Today | See what it's worth now |
| 20 Feb 2026 | £220,000 |
No other historical records.
29, Surfeit Hill Road, Cradley Heath B64 7EB
| Today | See what it's worth now |
| 20 Feb 2026 | £240,000 |
| 26 Mar 2021 | £167,500 |
No other historical records.
48, Best Street, Cradley Heath B64 5PA
| Today | See what it's worth now |
| 18 Feb 2026 | £176,000 |
| 23 Jun 2023 | £152,500 |
40, Trejon Road, Cradley Heath B64 7HL
| Today | See what it's worth now |
| 18 Feb 2026 | £220,000 |
No other historical records.
4, Lee Road, Cradley Heath B64 7HS
| Today | See what it's worth now |
| 10 Feb 2026 | £315,000 |
No other historical records.
22, Norwood Avenue, Cradley Heath B64 7NJ
| Today | See what it's worth now |
| 6 Feb 2026 | £210,000 |
| 24 Feb 2017 | £116,000 |
No other historical records.
30, Chester Road, Cradley Heath B64 6AA
| Today | See what it's worth now |
| 3 Feb 2026 | £170,000 |
| 30 Oct 2020 | £130,000 |
No other historical records.
45, Elbow Street, Cradley Heath B64 6JP

| Today | See what it's worth now |
| 30 Jan 2026 | £125,000 |
| 28 Sep 2023 | £118,000 |
12, Beauty Bank, Cradley Heath B64 7HY
| Today | See what it's worth now |
| 30 Jan 2026 | £235,000 |
| 4 May 2001 | £70,250 |
No other historical records.
23, Clifton Street, Cradley Heath B64 6QH
| Today | See what it's worth now |
| 23 Jan 2026 | £192,500 |
| 19 Apr 2022 | £178,000 |
71b, Cradley Road, Cradley Heath B64 6AG
| Today | See what it's worth now |
| 23 Jan 2026 | £185,000 |
No other historical records.
89, Sutherland Road, Cradley Heath B64 6EB
| Today | See what it's worth now |
| 16 Jan 2026 | £270,000 |
| 5 Dec 2003 | £138,995 |
No other historical records.
18, Barn Close, Cradley Heath B64 7NQ
| Today | See what it's worth now |
| 16 Jan 2026 | £215,000 |
| 12 Aug 2021 | £180,000 |
33, Victoria Gardens, Cradley Heath B64 5LX
| Today | See what it's worth now |
| 13 Jan 2026 | £157,000 |
| 26 May 2006 | £109,950 |
Source Acknowledgement: © Crown copyright. England and Wales house price data is publicly available information produced by the HM Land Registry.This material was last updated on 9 July 2026. It covers the period from 1 January 1995 to 30 April 2026 and contains property transactions which have been registered during that period. Contains HM Land Registry data © Crown copyright and database right 2026. This data is licensed under the Open Government Licence v3.0.
Disclaimer: Rightmove.co.uk provides this HM Land Registry data "as is". The burden for fitness of the data relies completely with the user and is provided for informational purposes only. No warranty, express or implied, is given relating to the accuracy of content of the HM Land Registry data and Rightmove does not accept any liability for error or omission. If you have found an error with the data or need further information please contact HM Land Registry.
Permitted Use: Viewers of this Information are granted permission to access this Crown copyright material and to download it onto electronic, magnetic, optical or similar storage media provided that such activities are for private research, study or in-house use only. Any other use of the material requires the formal written permission of Land Registry which can be requested from us, and is subject to an additional licence and associated charge.
Rightmove takes no liability for your use of, or reliance on, Rightmove's Instant Valuation due to the limitations of our tracking tool listed here. Use of this tool is taken entirely at your own risk. All rights reserved.