
House Prices in Barlby
House prices in Barlby have an overall average of £247,606 over the last year.
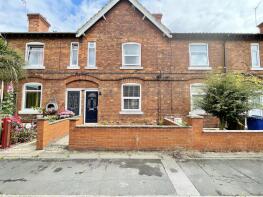
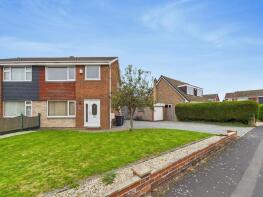
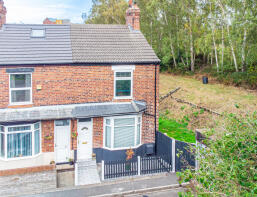
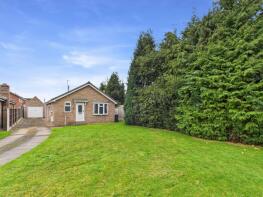
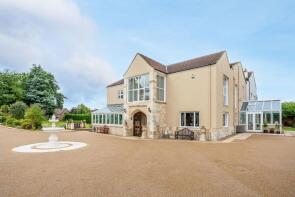
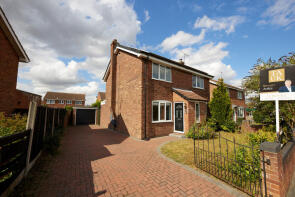
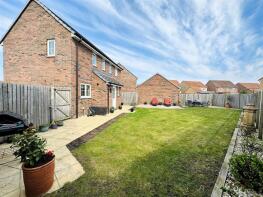
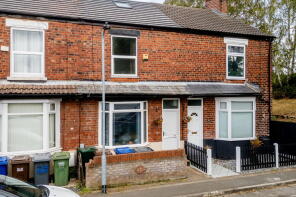
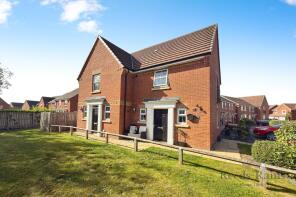
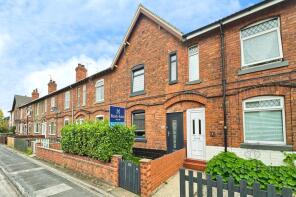
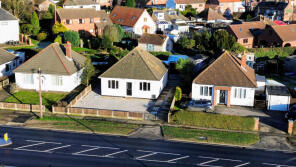
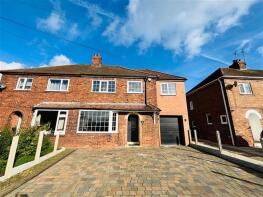
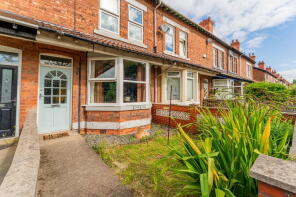
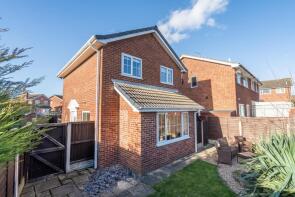
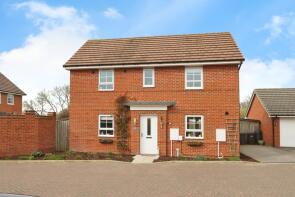
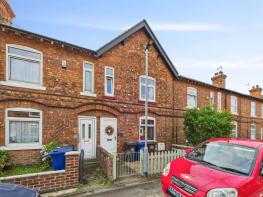
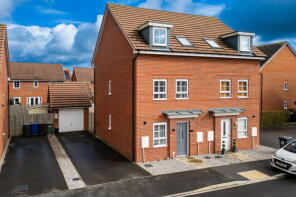
The majority of properties sold in Barlby during the last year were detached properties, selling for an average price of £318,949. Terraced properties sold for an average of £191,700, with semi-detached properties fetching £233,692.
Overall, the historical sold prices in Barlby over the last year were 5% up on the previous year and 4% up on the 2023 peak of £238,846.
Properties Sold
7, John Street, Barlby, Selby YO8 5AJ
| Today | See what it's worth now |
| 29 Apr 2026 | £170,000 |
| 28 Jan 2022 | £150,000 |
49, The Charters, Barlby, Selby YO8 5JD
| Today | See what it's worth now |
| 24 Apr 2026 | £230,000 |
| 21 Oct 2020 | £190,000 |
27, Thomas Street, Barlby, Selby YO8 5AQ
| Today | See what it's worth now |
| 23 Mar 2026 | £175,000 |
| 25 Aug 2022 | £160,000 |
10, Sycamore Road, Barlby, Selby YO8 5XB
| Today | See what it's worth now |
| 13 Mar 2026 | £230,000 |
| 14 Sep 2018 | £162,000 |
No other historical records.
Osgodby Hall, Hall Garth, Osgodby YO8 5SR
| Today | See what it's worth now |
| 13 Mar 2026 | £750,000 |
No other historical records.
21, Bramley Avenue, Barlby, Selby YO8 5EY
| Today | See what it's worth now |
| 9 Mar 2026 | £259,435 |
| 25 Sep 2017 | £235,000 |
15, Riverside Avenue, Barlby, Selby YO8 5NA
| Today | See what it's worth now |
| 3 Mar 2026 | £270,000 |
| 16 Dec 2016 | £210,000 |
No other historical records.
25, Thomas Street, Barlby, Selby YO8 5AQ
| Today | See what it's worth now |
| 2 Mar 2026 | £160,000 |
| 4 Apr 2018 | £116,000 |
18, Pastures Close, Barlby, Selby YO8 5NN
| Today | See what it's worth now |
| 27 Feb 2026 | £140,000 |
| 7 May 2021 | £115,000 |
Pipistrelle Barn, South Duffield Road, Osgodby, Selby YO8 5HW
| Today | See what it's worth now |
| 25 Feb 2026 | £210,000 |
| 24 May 2013 | £123,000 |
No other historical records.
4, Pond Street, Barlby, Selby YO8 5AS
| Today | See what it's worth now |
| 17 Feb 2026 | £185,000 |
| 29 Oct 2021 | £174,750 |
Croft View, York Road, Barlby, Selby YO8 5JH
| Today | See what it's worth now |
| 13 Feb 2026 | £285,000 |
| 6 Sep 2021 | £250,000 |
10, George Terrace, Barlby, Selby YO8 5HA
| Today | See what it's worth now |
| 13 Feb 2026 | £224,000 |
| 7 Nov 2014 | £125,000 |
Hillside, Hull Road, Selby YO8 5HZ
| Today | See what it's worth now |
| 30 Jan 2026 | £250,000 |
| 12 Apr 2024 | £140,000 |
No other historical records.
4, George Terrace, Barlby, Selby YO8 5HA
| Today | See what it's worth now |
| 23 Jan 2026 | £350,000 |
| 11 Nov 2011 | £130,000 |
11, Barlby Road, Barlby, Selby YO8 5AB
| Today | See what it's worth now |
| 16 Jan 2026 | £173,000 |
| 29 Jul 2021 | £147,500 |
31, Acorn Close, Barlby, Selby YO8 5UT
| Today | See what it's worth now |
| 15 Jan 2026 | £260,000 |
| 15 Jul 2022 | £260,000 |
31, Kaye Drive, Osgodby, Selby YO8 5ZY
| Today | See what it's worth now |
| 19 Dec 2025 | £350,000 |
| 28 Jun 2007 | £219,995 |
No other historical records.
5, York Road, Barlby, Selby YO8 5JY
| Today | See what it's worth now |
| 18 Dec 2025 | £192,500 |
| 28 Jul 2021 | £168,000 |
25, Orchard Drive, Barlby, Selby YO8 5NG
| Today | See what it's worth now |
| 16 Dec 2025 | £184,000 |
| 27 Sep 2019 | £155,995 |
No other historical records.
8, Olympia Crescent, Barlby, Selby YO8 5AG
| Today | See what it's worth now |
| 4 Dec 2025 | £155,000 |
| 6 Jul 2007 | £95,000 |
No other historical records.
19, Pastures Close, Barlby, Selby YO8 5NN
| Today | See what it's worth now |
| 28 Nov 2025 | £308,000 |
| 5 Oct 2018 | £229,995 |
No other historical records.
18, John Street, Barlby, Selby YO8 5AJ
| Today | See what it's worth now |
| 28 Nov 2025 | £170,000 |
| 29 Nov 2024 | £160,000 |
Source Acknowledgement: © Crown copyright. England and Wales house price data is publicly available information produced by the HM Land Registry.This material was last updated on 9 July 2026. It covers the period from 1 January 1995 to 30 April 2026 and contains property transactions which have been registered during that period. Contains HM Land Registry data © Crown copyright and database right 2026. This data is licensed under the Open Government Licence v3.0.
Disclaimer: Rightmove.co.uk provides this HM Land Registry data "as is". The burden for fitness of the data relies completely with the user and is provided for informational purposes only. No warranty, express or implied, is given relating to the accuracy of content of the HM Land Registry data and Rightmove does not accept any liability for error or omission. If you have found an error with the data or need further information please contact HM Land Registry.
Permitted Use: Viewers of this Information are granted permission to access this Crown copyright material and to download it onto electronic, magnetic, optical or similar storage media provided that such activities are for private research, study or in-house use only. Any other use of the material requires the formal written permission of Land Registry which can be requested from us, and is subject to an additional licence and associated charge.
Rightmove takes no liability for your use of, or reliance on, Rightmove's Instant Valuation due to the limitations of our tracking tool listed here. Use of this tool is taken entirely at your own risk. All rights reserved.