
House Prices in Osgodby
House prices in Osgodby have an overall average of £328,830 over the last year.
The majority of properties sold in Osgodby during the last year were detached properties, selling for an average price of £385,750. Semi-detached properties sold for an average of £216,238, with terraced properties fetching £210,000.
Overall, the historical sold prices in Osgodby over the last year were 13% up on the previous year and 21% up on the 2021 peak of £272,366.
Properties Sold
Berhilholme, Hull Road, Osgodby, Selby YO8 5HG
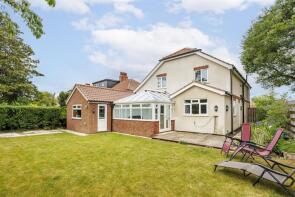
| Today | See today's value |
| 29 Jul 2026 | £385,000 |
| 26 Feb 2021 | £330,000 |
36, St Leonards Avenue, Osgodby, Selby YO8 5HE
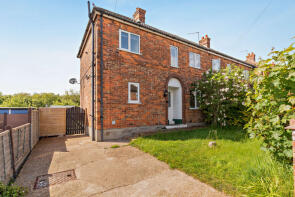
| Today | See today's value |
| 24 Jul 2026 | £187,000 |
| 16 Apr 2021 | £156,000 |
11, St Leonards Avenue, Osgodby, Selby YO8 5HE

| Today | See today's value |
| 30 Jun 2026 | £200,000 |
| 9 Dec 2022 | £196,000 |
15, Tune Street, Osgodby, Selby YO8 5HL
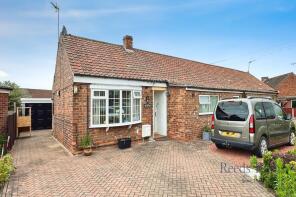
| Today | See today's value |
| 18 Jun 2026 | £188,000 |
| 5 Jan 2018 | £146,000 |
No other historical records.
29, Kaye Drive, Osgodby, Selby YO8 5ZY

| Today | See today's value |
| 12 May 2026 | £390,000 |
| 30 Jan 2007 | £239,995 |
No other historical records.
Osgodby Hall, Hall Garth, Osgodby YO8 5SR
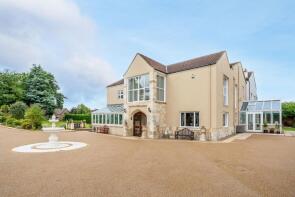
| Today | See today's value |
| 13 Mar 2026 | £750,000 |
No other historical records.
Pipistrelle Barn, South Duffield Road, Osgodby, Selby YO8 5HW
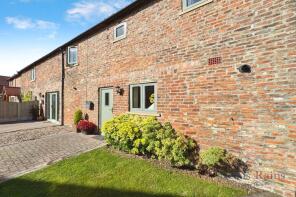
| Today | See today's value |
| 25 Feb 2026 | £210,000 |
| 24 May 2013 | £123,000 |
No other historical records.
Hillside, Hull Road, Selby YO8 5HZ
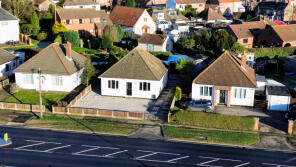
| Today | See today's value |
| 30 Jan 2026 | £250,000 |
| 12 Apr 2024 | £140,000 |
No other historical records.
31, Kaye Drive, Osgodby, Selby YO8 5ZY
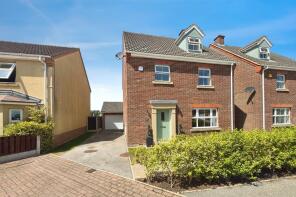
| Today | See today's value |
| 19 Dec 2025 | £350,000 |
| 28 Jun 2007 | £219,995 |
No other historical records.
6, The Fossards, Osgodby, Selby YO8 5GY
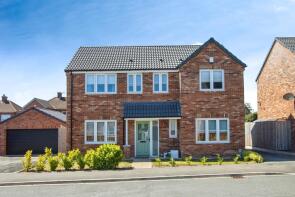
| Today | See today's value |
| 19 Dec 2025 | £350,000 |
| 29 Oct 2021 | £325,000 |
No other historical records.
20, Tune Street, Osgodby, Selby YO8 5HL
| Today | See today's value |
| 21 Nov 2025 | £289,950 |
| 15 Jul 2024 | £275,000 |
6, Tune Street, Osgodby YO8 5HL

| Today | See today's value |
| 14 Nov 2025 | £220,000 |
No other historical records.
27, Kaye Drive, Osgodby, Selby YO8 5ZY

| Today | See today's value |
| 3 Nov 2025 | £325,000 |
| 20 Mar 2007 | £229,995 |
No other historical records.
25, The Hollies, Osgodby YO8 5ZU

| Today | See today's value |
| 31 Oct 2025 | £262,500 |
No other historical records.
Arrington House, Hall Garth, Osgodby YO8 5SR

| Today | See today's value |
| 21 Oct 2025 | £575,000 |
No other historical records.
Bungalow, South Duffield Road, Osgodby YO8 5HP

| Today | See today's value |
| 8 Aug 2025 | £327,500 |
No other historical records.
Sunnyside, Hull Road, Osgodby, Selby YO8 5HG

| Today | See today's value |
| 1 Aug 2025 | £265,000 |
| 22 Feb 2019 | £168,000 |
No other historical records.
11a, St Leonards Avenue, Osgodby, Selby YO8 5HE

| Today | See today's value |
| 29 May 2025 | £218,500 |
| 21 Jul 2023 | £215,000 |
4, The Crescent, Sand Lane, Osgodby YO8 5HT

| Today | See today's value |
| 7 May 2025 | £165,000 |
No other historical records.
Stoney Cove, Sand Lane, Osgodby, Selby YO8 5HN

| Today | See today's value |
| 28 Apr 2025 | £350,000 |
| 31 Oct 2016 | £235,000 |
The Cottage, Sand Lane, Osgodby, Selby YO8 5HN

| Today | See today's value |
| 17 Apr 2025 | £322,500 |
| 20 Sep 2021 | £255,000 |
4, William Road, Osgodby YO8 5HJ

| Today | See today's value |
| 24 Feb 2025 | £280,000 |
No other historical records.
Teathill Cottage, Sand Lane, Osgodby YO8 5HT
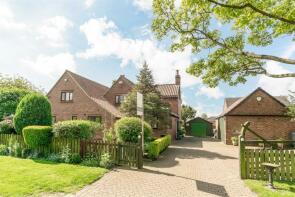
| Today | See today's value |
| 6 Feb 2025 | £575,000 |
| 4 Jul 2012 | £348,000 |
No other historical records.


Rightmove takes no liability for your use of, or reliance on, Rightmove's Instant Valuation due to the limitations of our tracking tool listed here. Use of this tool is taken entirely at your own risk. All rights reserved.