
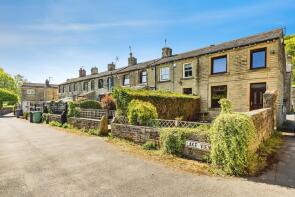
House Prices in Berry Brow
House prices in Berry Brow have an overall average of £263,027 over the last year.
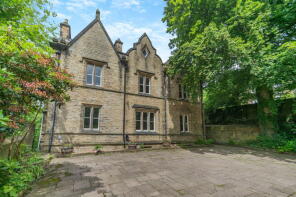
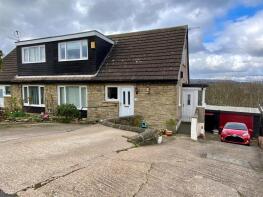
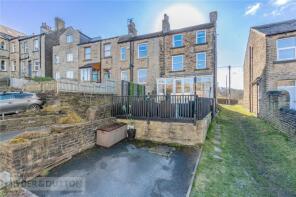
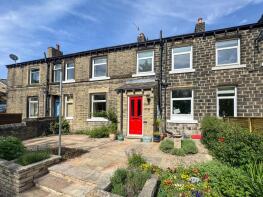
The majority of properties sold in Berry Brow during the last year were semi-detached properties, selling for an average price of £203,464. Terraced properties sold for an average of £211,755, with detached properties fetching £396,750.
Overall, the historical sold prices in Berry Brow over the last year were 28% up on the previous year and 29% up on the 2022 peak of £204,615.
Properties Sold
39, Blagden Lane, Newsome, Huddersfield HD4 6JZ
| Today | See what it's worth now |
| 27 Mar 2026 | £282,500 |
| 20 Jun 2022 | £245,000 |
8, Hanging Stone Road, Berry Brow, Huddersfield HD4 7QT
| Today | See what it's worth now |
| 26 Mar 2026 | £197,500 |
No other historical records.
27, Royd Terrace, Armitage Bridge, Huddersfield HD4 7NZ
| Today | See what it's worth now |
| 27 Feb 2026 | £218,800 |
| 16 Aug 2023 | £170,000 |
46, Hanging Stone Road, Berry Brow, Huddersfield HD4 7QT
| Today | See what it's worth now |
| 25 Feb 2026 | £200,100 |
| 30 Sep 2016 | £119,500 |
1, Lake View, Armitage Bridge, Huddersfield HD4 7NX
| Today | See what it's worth now |
| 16 Feb 2026 | £165,000 |
| 15 Dec 2006 | £130,500 |
15, Priestley Grove, Taylor Hill, Huddersfield HD4 7RG

| Today | See what it's worth now |
| 30 Jan 2026 | £375,000 |
| 31 May 2002 | £144,950 |
8, Edale Avenue, Newsome, Huddersfield HD4 6LG
| Today | See what it's worth now |
| 26 Jan 2026 | £265,000 |
| 20 Dec 2002 | £89,000 |
No other historical records.
27, Ladyhouse Lane, Berry Brow, Huddersfield HD4 7QD

| Today | See what it's worth now |
| 21 Jan 2026 | £352,500 |
| 1 Jun 2012 | £165,000 |
No other historical records.
18, Wood End Road, Armitage Bridge, Huddersfield HD4 7PF
| Today | See what it's worth now |
| 9 Jan 2026 | £130,000 |
| 16 Sep 2005 | £91,000 |
No other historical records.
21, Wood End Road, Armitage Bridge, Huddersfield HD4 7PF
| Today | See what it's worth now |
| 15 Dec 2025 | £255,000 |
| 16 Oct 2024 | £145,000 |
No other historical records.
39, Berry View, Newsome, Huddersfield HD4 6LQ
| Today | See what it's worth now |
| 8 Dec 2025 | £270,000 |
| 2 Oct 2014 | £174,000 |
33, Stoney Cross Street, Taylor Hill, Huddersfield HD4 6EY

| Today | See what it's worth now |
| 3 Nov 2025 | £137,000 |
| 2 Jul 2008 | £90,000 |
6, Newsome Road South, Berry Brow, Huddersfield HD4 7PT
| Today | See what it's worth now |
| 31 Oct 2025 | £173,000 |
No other historical records.
12, Moor Cottage Close, Netherton, Huddersfield HD4 7LF
| Today | See what it's worth now |
| 17 Oct 2025 | £210,000 |
| 8 Dec 2023 | £165,000 |
23, Stoney Cross Street, Taylor Hill, Huddersfield HD4 6EY
| Today | See what it's worth now |
| 16 Oct 2025 | £158,000 |
| 13 Apr 2007 | £138,500 |
78, Newsome Road South, Berry Brow, Huddersfield HD4 7PT
| Today | See what it's worth now |
| 10 Oct 2025 | £125,000 |
No other historical records.
The Old Vicarage, Carriage Drive, Berry Brow, Huddersfield HD4 7ND
| Today | See what it's worth now |
| 10 Oct 2025 | £750,000 |
No other historical records.
56, Blagden Lane, Newsome, Huddersfield HD4 6JZ
| Today | See what it's worth now |
| 3 Oct 2025 | £225,000 |
No other historical records.
12, Mansion Gardens, Taylor Hill, Huddersfield HD4 7RF

| Today | See what it's worth now |
| 26 Sep 2025 | £320,000 |
| 10 Mar 2021 | £280,000 |
No other historical records.
19a, Ladyhouse Lane, Berry Brow, Huddersfield HD4 7QD
| Today | See what it's worth now |
| 26 Sep 2025 | £145,000 |
| 21 Apr 2021 | £115,000 |
4 6, Windmill Terrace, Berry Brow, Huddersfield HD4 7QL
| Today | See what it's worth now |
| 27 Aug 2025 | £178,000 |
| 30 Jul 2004 | £125,000 |
No other historical records.
8, Moor Cottage Close, Netherton, Huddersfield HD4 7LF
| Today | See what it's worth now |
| 8 Aug 2025 | £182,500 |
| 5 Oct 1998 | £56,000 |
No other historical records.
156, Moor Lane, Netherton, Huddersfield HD4 7JJ

| Today | See what it's worth now |
| 8 Aug 2025 | £190,000 |
| 7 Aug 2015 | £123,000 |
No other historical records.
Source Acknowledgement: © Crown copyright. England and Wales house price data is publicly available information produced by the HM Land Registry.This material was last updated on 9 July 2026. It covers the period from 1 January 1995 to 30 April 2026 and contains property transactions which have been registered during that period. Contains HM Land Registry data © Crown copyright and database right 2026. This data is licensed under the Open Government Licence v3.0.
Disclaimer: Rightmove.co.uk provides this HM Land Registry data "as is". The burden for fitness of the data relies completely with the user and is provided for informational purposes only. No warranty, express or implied, is given relating to the accuracy of content of the HM Land Registry data and Rightmove does not accept any liability for error or omission. If you have found an error with the data or need further information please contact HM Land Registry.
Permitted Use: Viewers of this Information are granted permission to access this Crown copyright material and to download it onto electronic, magnetic, optical or similar storage media provided that such activities are for private research, study or in-house use only. Any other use of the material requires the formal written permission of Land Registry which can be requested from us, and is subject to an additional licence and associated charge.
Rightmove takes no liability for your use of, or reliance on, Rightmove's Instant Valuation due to the limitations of our tracking tool listed here. Use of this tool is taken entirely at your own risk. All rights reserved.