
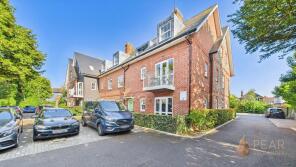
House Prices in BN13
House prices in BN13 have an overall average of £382,453 over the last year.
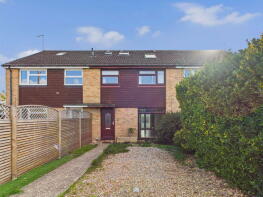
The majority of properties sold in BN13 during the last year were semi-detached properties, selling for an average price of £379,505. Detached properties sold for an average of £514,183, with terraced properties fetching £334,900.
Overall, the historical sold prices in BN13 over the last year were similar to the previous year and 3% up on the 2023 peak of £370,473.
Properties Sold
55, Stone Lane, Salvington, Worthing BN13 2BB
| Today | See what it's worth now |
| 24 Apr 2026 | £354,500 |
| 18 Aug 2006 | £219,000 |
19, Ontario Close, Durrington, Worthing BN13 2TE
| Today | See what it's worth now |
| 24 Apr 2026 | £276,000 |
| 10 Jul 2020 | £248,995 |
8, Radnor Close, Tarring, Worthing BN13 1DJ
| Today | See what it's worth now |
| 20 Apr 2026 | £290,000 |
| 24 Jun 2011 | £179,000 |
No other historical records.
Extensions and planning permission in BN13
See planning approval stats, extension build costs and value added estimates.

22, Rockingham Close, Durrington, Worthing BN13 2NU

| Today | See what it's worth now |
| 10 Apr 2026 | £290,000 |
| 13 Nov 2009 | £175,000 |
No other historical records.
129, Terringes Avenue, Tarring, Worthing BN13 1JN
| Today | See what it's worth now |
| 10 Apr 2026 | £387,500 |
| 19 Mar 2014 | £225,000 |
No other historical records.
Flat 45, 2 Highdown Court, Durrington Lane, Durrington, Worthing BN13 2GZ
| Today | See what it's worth now |
| 9 Apr 2026 | £90,000 |
| 1 Sep 2014 | £162,500 |
Flat 1, 1, Parkfield Road, Tarring, Worthing BN13 1FB
| Today | See what it's worth now |
| 8 Apr 2026 | £282,500 |
| 1 Jul 2019 | £270,000 |
No other historical records.
Orchard Cottage, Mill Lane, Salvington, Worthing BN13 3DJ
| Today | See what it's worth now |
| 8 Apr 2026 | £717,000 |
| 4 Jan 2013 | £420,000 |
178, Littlehampton Road, Salvington, Worthing BN13 1QY
| Today | See what it's worth now |
| 7 Apr 2026 | £440,000 |
| 15 Dec 2010 | £280,000 |
Flat 1, 52 Catherine Lodge, Bolsover Road, Castle, Worthing BN13 1NT
| Today | See what it's worth now |
| 2 Apr 2026 | £185,000 |
| 26 Oct 2018 | £180,000 |
10, Greystone Avenue, Tarring, Worthing BN13 1LR
| Today | See what it's worth now |
| 2 Apr 2026 | £205,000 |
| 17 Feb 2022 | £220,000 |
16, Radnor Close, Tarring, Worthing BN13 1DJ
| Today | See what it's worth now |
| 30 Mar 2026 | £367,000 |
| 29 Mar 1996 | £52,000 |
No other historical records.
32, Narcissus Rise, Northbrook, Worthing BN13 3XY

| Today | See what it's worth now |
| 27 Mar 2026 | £320,000 |
| 5 Oct 2022 | £290,000 |
No other historical records.
2, Colne Close, Durrington, Worthing BN13 3LP
| Today | See what it's worth now |
| 27 Mar 2026 | £415,000 |
| 12 May 2014 | £289,950 |
5, Hammond Close, Salvington, Worthing BN13 3FH
| Today | See what it's worth now |
| 23 Mar 2026 | £400,000 |
| 12 Sep 2012 | £267,500 |
No other historical records.
65, Willow Crescent, Northbrook, Worthing BN13 2SY
| Today | See what it's worth now |
| 20 Mar 2026 | £272,000 |
| 15 May 2015 | £217,000 |
8, Dianthus Grove, Northbrook, Worthing BN13 3ZA
| Today | See what it's worth now |
| 20 Mar 2026 | £337,000 |
| 9 Dec 2022 | £332,000 |
No other historical records.
21, Cheviot Close, Salvington, Worthing BN13 2LL
| Today | See what it's worth now |
| 18 Mar 2026 | £550,000 |
| 3 Apr 2017 | £410,000 |
56, New Road, Durrington, Worthing BN13 3JQ
| Today | See what it's worth now |
| 18 Mar 2026 | £360,000 |
| 25 Jan 2024 | £350,000 |
No other historical records.
Flat 1, 77 Garratt House, Bolsover Road, Castle, Worthing BN13 1NR
| Today | See what it's worth now |
| 16 Mar 2026 | £210,000 |
| 25 Oct 2017 | £189,995 |
No other historical records.
39, Rogate Road, Salvington, Worthing BN13 2DY
| Today | See what it's worth now |
| 13 Mar 2026 | £325,000 |
No other historical records.
47, Ivydore Avenue, Durrington, Worthing BN13 3JH
| Today | See what it's worth now |
| 12 Mar 2026 | £455,000 |
| 3 Jun 2016 | £390,000 |
7, Exmoor Drive, Salvington, Worthing BN13 2PH
| Today | See what it's worth now |
| 11 Mar 2026 | £435,000 |
| 15 Nov 2019 | £380,000 |
No other historical records.
Source Acknowledgement: © Crown copyright. England and Wales house price data is publicly available information produced by the HM Land Registry.This material was last updated on 9 July 2026. It covers the period from 1 January 1995 to 30 April 2026 and contains property transactions which have been registered during that period. Contains HM Land Registry data © Crown copyright and database right 2026. This data is licensed under the Open Government Licence v3.0.
Disclaimer: Rightmove.co.uk provides this HM Land Registry data "as is". The burden for fitness of the data relies completely with the user and is provided for informational purposes only. No warranty, express or implied, is given relating to the accuracy of content of the HM Land Registry data and Rightmove does not accept any liability for error or omission. If you have found an error with the data or need further information please contact HM Land Registry.
Permitted Use: Viewers of this Information are granted permission to access this Crown copyright material and to download it onto electronic, magnetic, optical or similar storage media provided that such activities are for private research, study or in-house use only. Any other use of the material requires the formal written permission of Land Registry which can be requested from us, and is subject to an additional licence and associated charge.
Rightmove takes no liability for your use of, or reliance on, Rightmove's Instant Valuation due to the limitations of our tracking tool listed here. Use of this tool is taken entirely at your own risk. All rights reserved.