
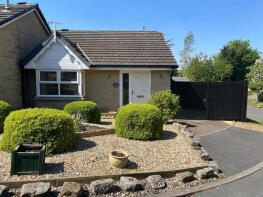
House Prices in Carrbrook
House prices in Carrbrook have an overall average of £289,907 over the last year.
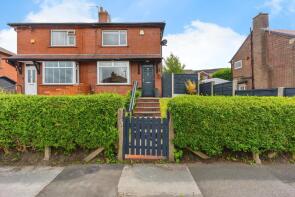
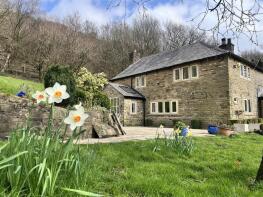
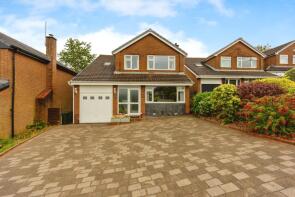
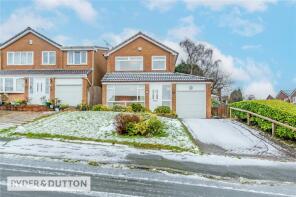
The majority of properties sold in Carrbrook during the last year were semi-detached properties, selling for an average price of £279,900. Detached properties sold for an average of £360,000, with terraced properties fetching £236,492.
Overall, the historical sold prices in Carrbrook over the last year were 7% up on the previous year and 8% up on the 2023 peak of £269,556.
Properties Sold
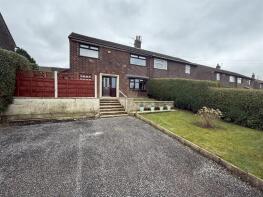
2, Long Row, Stalybridge SK15 3PG
| Today | See what it's worth now |
| 10 Mar 2026 | £200,000 |
| 5 Jul 2019 | £115,500 |
76, Moorgate Road, Carrbrook, Stalybridge SK15 3NJ
| Today | See what it's worth now |
| 27 Feb 2026 | £365,000 |
| 26 Jan 2017 | £210,000 |
6, Sparrowfield Close, Stalybridge SK15 3NN
| Today | See what it's worth now |
| 20 Feb 2026 | £298,000 |
| 14 Aug 2009 | £125,000 |
82, Moorgate Road, Carrbrook, Stalybridge SK15 3NJ
| Today | See what it's worth now |
| 20 Feb 2026 | £450,000 |
| 20 Feb 2026 | £450,000 |
No other historical records.
48, Buckton Vale Road, Stalybridge SK15 3PJ
| Today | See what it's worth now |
| 6 Feb 2026 | £260,000 |
| 24 May 2006 | £162,500 |
No other historical records.
48, Moorland Road, Stalybridge SK15 3JZ
| Today | See what it's worth now |
| 19 Dec 2025 | £220,000 |
| 7 Aug 2020 | £117,000 |
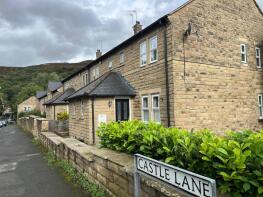
11, Oak Bank, Castle Lane, Stalybridge SK15 3PB
| Today | See what it's worth now |
| 12 Dec 2025 | £220,000 |
| 11 Sep 2015 | £132,000 |
24, Fold Crescent, Stalybridge SK15 3ND
| Today | See what it's worth now |
| 28 Nov 2025 | £313,000 |
| 16 Dec 2011 | £145,000 |
4, Heyside Close, Carrbrook, Stalybridge SK15 3LZ
| Today | See what it's worth now |
| 28 Nov 2025 | £190,000 |
| 28 Aug 1998 | £48,000 |
No other historical records.
1a, Dovebrook Close, Stalybridge SK15 3NH
| Today | See what it's worth now |
| 20 Nov 2025 | £260,000 |
| 9 Jun 2022 | £260,000 |
7, East Road, Stalybridge SK15 3LN
| Today | See what it's worth now |
| 14 Nov 2025 | £125,000 |
| 12 Feb 2016 | £65,000 |
No other historical records.
30, Printers Drive, Carrbrook, Stalybridge SK15 3FN
| Today | See what it's worth now |
| 14 Nov 2025 | £260,000 |
No other historical records.
26, Bank Road, Stalybridge SK15 3JX
| Today | See what it's worth now |
| 7 Nov 2025 | £226,000 |
| 13 Nov 2020 | £140,000 |
57, Castle Lane, Stalybridge SK15 3PA
| Today | See what it's worth now |
| 12 Sep 2025 | £275,000 |
| 14 Dec 2010 | £153,000 |
50, Bank Road, Stalybridge SK15 3LB
| Today | See what it's worth now |
| 11 Sep 2025 | £185,000 |
| 9 Oct 2019 | £126,500 |
14, Buckton Vale Mews, Stalybridge SK15 3SE

| Today | See what it's worth now |
| 5 Sep 2025 | £237,950 |
| 8 Apr 2022 | £215,000 |
22, Carr Cottages, Carr Lane, Stalybridge SK15 3NS
| Today | See what it's worth now |
| 11 Aug 2025 | £751,000 |
| 8 Apr 2011 | £450,000 |
No other historical records.
20, Ash Hill Drive, Mossley OL5 9PW
| Today | See what it's worth now |
| 30 Jul 2025 | £287,000 |
No other historical records.
28, Fold Crescent, Stalybridge SK15 3ND
| Today | See what it's worth now |
| 25 Jul 2025 | £295,000 |
| 25 May 2006 | £217,500 |
No other historical records.
6, Moorfield Heights, Stalybridge SK15 3RB
| Today | See what it's worth now |
| 22 Jul 2025 | £257,000 |
| 7 Apr 2006 | £170,000 |
32, Moorland Road, Stalybridge SK15 3JZ
| Today | See what it's worth now |
| 11 Jul 2025 | £253,000 |
| 5 Jul 2012 | £96,000 |
548, Huddersfield Road, Stalybridge SK15 3NP

| Today | See what it's worth now |
| 27 Jun 2025 | £310,000 |
| 22 Feb 2013 | £135,000 |
No other historical records.
11b, Carrbrook Crescent, Stalybridge SK15 3LP
| Today | See what it's worth now |
| 26 Jun 2025 | £375,000 |
| 20 Jan 2023 | £375,000 |
No other historical records.
Source Acknowledgement: © Crown copyright. England and Wales house price data is publicly available information produced by the HM Land Registry.This material was last updated on 9 July 2026. It covers the period from 1 January 1995 to 30 April 2026 and contains property transactions which have been registered during that period. Contains HM Land Registry data © Crown copyright and database right 2026. This data is licensed under the Open Government Licence v3.0.
Disclaimer: Rightmove.co.uk provides this HM Land Registry data "as is". The burden for fitness of the data relies completely with the user and is provided for informational purposes only. No warranty, express or implied, is given relating to the accuracy of content of the HM Land Registry data and Rightmove does not accept any liability for error or omission. If you have found an error with the data or need further information please contact HM Land Registry.
Permitted Use: Viewers of this Information are granted permission to access this Crown copyright material and to download it onto electronic, magnetic, optical or similar storage media provided that such activities are for private research, study or in-house use only. Any other use of the material requires the formal written permission of Land Registry which can be requested from us, and is subject to an additional licence and associated charge.
Rightmove takes no liability for your use of, or reliance on, Rightmove's Instant Valuation due to the limitations of our tracking tool listed here. Use of this tool is taken entirely at your own risk. All rights reserved.