
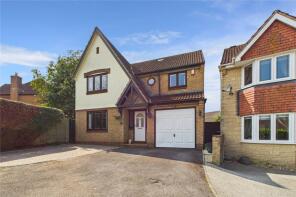
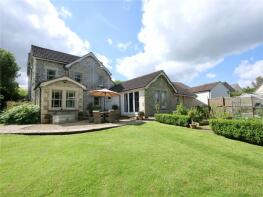
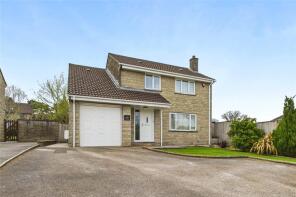
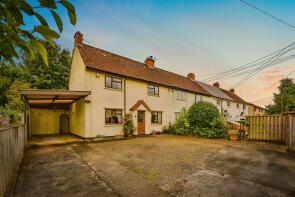
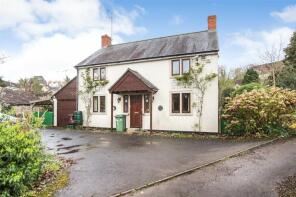
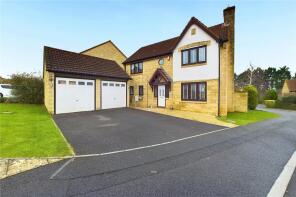
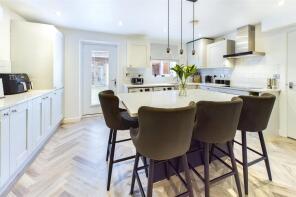
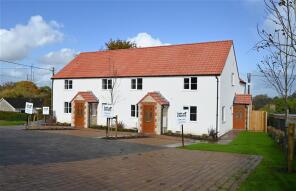
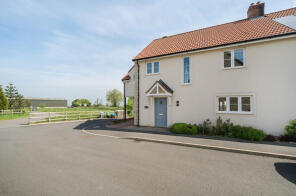
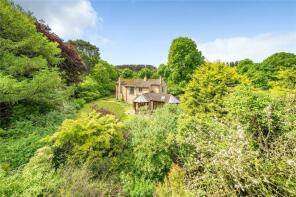
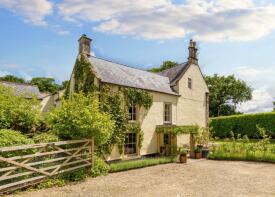
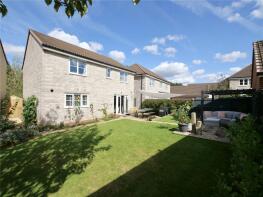
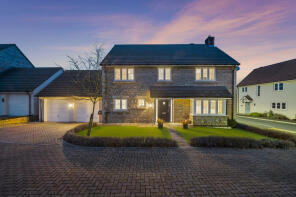
House Prices in Chilcompton
House prices in Chilcompton have an overall average of £416,563 over the last year.
The majority of properties sold in Chilcompton during the last year were detached properties, selling for an average price of £536,312. Terraced properties sold for an average of £266,238, with semi-detached properties fetching £297,667.
Overall, the historical sold prices in Chilcompton over the last year were 11% down on the previous year and 9% down on the 2023 peak of £456,233.
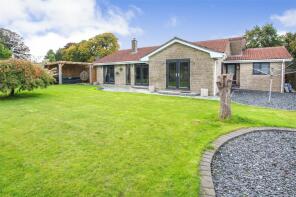
Properties Sold
34, Stockhill Road, Chilcompton, Radstock BA3 4JJ
| Today | See what it's worth now |
| 20 Mar 2026 | £320,000 |
| 5 Mar 2021 | £269,950 |
The Gables, Frys Well, Chilcompton, Radstock BA3 4HA
| Today | See what it's worth now |
| 20 Mar 2026 | £762,500 |
| 1 Nov 1999 | £90,000 |
No other historical records.
4 Honeypot House, Sawyers Close, Chilcompton, Radstock BA3 4FB
| Today | See what it's worth now |
| 20 Feb 2026 | £445,000 |
| 8 Aug 2018 | £397,000 |
14, Wells Road, Chilcompton, Radstock BA3 4EX

| Today | See what it's worth now |
| 12 Dec 2025 | £257,000 |
No other historical records.
The Old Country Store, The Street, Chilcompton, Radstock BA3 4HB
| Today | See what it's worth now |
| 3 Dec 2025 | £257,950 |
| 8 Jul 2022 | £225,000 |
Berneside, Wells Road, Chilcompton, Radstock BA3 4ET
| Today | See what it's worth now |
| 19 Nov 2025 | £410,000 |
| 10 Aug 2001 | £135,000 |
No other historical records.
2, Broadway, Chilcompton, Radstock BA3 4JW
| Today | See what it's worth now |
| 18 Nov 2025 | £325,000 |
| 19 May 1999 | £57,000 |
No other historical records.
13, Wells Road, Chilcompton, Radstock BA3 4EX
| Today | See what it's worth now |
| 13 Nov 2025 | £230,000 |
| 8 Mar 2021 | £208,950 |
Pinewood, Broadway, Chilcompton, Radstock BA3 4GT

| Today | See what it's worth now |
| 8 Oct 2025 | £405,000 |
| 2 Jun 2017 | £360,000 |
Sheridan, Frys Well, Chilcompton, Radstock BA3 4HA
| Today | See what it's worth now |
| 3 Oct 2025 | £260,000 |
No other historical records.
Lydford, Wells Road, Chilcompton, Radstock BA3 4ET
| Today | See what it's worth now |
| 24 Sep 2025 | £550,000 |
| 3 Oct 2006 | £328,000 |
2, Sawmill Gardens, Chilcompton, Radstock BA3 4FE
| Today | See what it's worth now |
| 14 Aug 2025 | £485,000 |
| 30 Jan 2003 | £225,000 |
Blencathra, Bakers Lane, Chilcompton, Radstock BA3 4EW
| Today | See what it's worth now |
| 8 Aug 2025 | £718,000 |
| 24 Jun 2011 | £390,000 |
2, Naishes Cross, Chilcompton, Radstock BA3 4JN
| Today | See what it's worth now |
| 16 Jul 2025 | £515,000 |
| 5 Jun 2007 | £299,950 |
No other historical records.
13, Highfield Crescent, Chilcompton, Radstock BA3 4JX
| Today | See what it's worth now |
| 4 Jul 2025 | £308,000 |
No other historical records.
Britannia Cottage, Britannia Close, Chilcompton, Radstock BA3 4LB
| Today | See what it's worth now |
| 20 Jun 2025 | £435,000 |
No other historical records.
3, Sheppards Walk, Chilcompton, Radstock BA3 4FF
| Today | See what it's worth now |
| 13 Jun 2025 | £480,000 |
| 3 Dec 2020 | £435,000 |
16, Mattick Mead, Chilcompton, Radstock BA3 4FU
| Today | See what it's worth now |
| 13 Jun 2025 | £375,000 |
No other historical records.
3, Aldhelm Rise, Bowden Hill, Chilcompton, Radstock BA3 4EN
| Today | See what it's worth now |
| 12 Jun 2025 | £259,950 |
No other historical records.
11, Pickford Fields, Chilcompton, Radstock BA3 4XU
| Today | See what it's worth now |
| 30 May 2025 | £435,000 |
| 27 Nov 2020 | £350,000 |
No other historical records.
Lindenlea, Abbey Road, Chilcompton, Radstock BA3 4HY
| Today | See what it's worth now |
| 12 May 2025 | £875,000 |
| 11 Apr 2022 | £875,000 |
Downside House, Wells Road, Chilcompton, Radstock BA3 4EU
| Today | See what it's worth now |
| 28 Mar 2025 | £1,450,000 |
| 19 Aug 2011 | £555,000 |
24, Brimscombe Meadow, Chilcompton, Radstock BA3 4FQ
| Today | See what it's worth now |
| 28 Mar 2025 | £500,000 |
| 5 Sep 2016 | £390,000 |
No other historical records.
Source Acknowledgement: © Crown copyright. England and Wales house price data is publicly available information produced by the HM Land Registry.This material was last updated on 9 July 2026. It covers the period from 1 January 1995 to 30 April 2026 and contains property transactions which have been registered during that period. Contains HM Land Registry data © Crown copyright and database right 2026. This data is licensed under the Open Government Licence v3.0.
Disclaimer: Rightmove.co.uk provides this HM Land Registry data "as is". The burden for fitness of the data relies completely with the user and is provided for informational purposes only. No warranty, express or implied, is given relating to the accuracy of content of the HM Land Registry data and Rightmove does not accept any liability for error or omission. If you have found an error with the data or need further information please contact HM Land Registry.
Permitted Use: Viewers of this Information are granted permission to access this Crown copyright material and to download it onto electronic, magnetic, optical or similar storage media provided that such activities are for private research, study or in-house use only. Any other use of the material requires the formal written permission of Land Registry which can be requested from us, and is subject to an additional licence and associated charge.
Rightmove takes no liability for your use of, or reliance on, Rightmove's Instant Valuation due to the limitations of our tracking tool listed here. Use of this tool is taken entirely at your own risk. All rights reserved.