
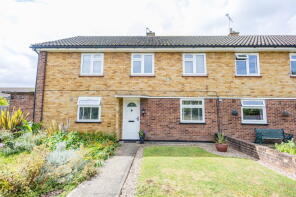
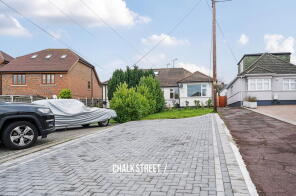
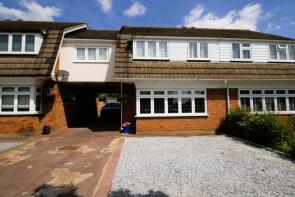
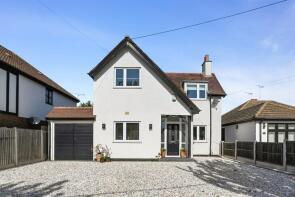
House Prices in Cranham
House prices in Cranham have an overall average of £555,189 over the last year.
The majority of properties sold in Cranham during the last year were semi-detached properties, selling for an average price of £584,494. Terraced properties sold for an average of £511,232, with detached properties fetching £755,231.
Overall, the historical sold prices in Cranham over the last year were 6% down on the previous year and 5% down on the 2023 peak of £581,501.
Properties Sold
9, Brookmans Close, Upminster RM14 1SJ
| Today | See what it's worth now |
| 24 Apr 2026 | £465,000 |
| 27 Jun 1997 | £88,000 |
No other historical records.
94, Ingrebourne Gardens, Upminster RM14 1BW
| Today | See what it's worth now |
| 7 Apr 2026 | £843,150 |
| 9 Nov 2007 | £496,000 |
6, Fairholme Gardens, Upminster RM14 1HH
| Today | See what it's worth now |
| 31 Mar 2026 | £510,000 |
| 21 Feb 2022 | £435,000 |
No other historical records.
71, Avon Road, Upminster RM14 1RF
| Today | See what it's worth now |
| 30 Mar 2026 | £550,000 |
| 23 Nov 2001 | £157,000 |
12, Dart Close, Upminster RM14 1PR
| Today | See what it's worth now |
| 27 Mar 2026 | £740,000 |
| 15 Feb 2011 | £346,000 |
212, Front Lane, Upminster RM14 1LW
| Today | See what it's worth now |
| 27 Mar 2026 | £560,000 |
| 11 Nov 2005 | £240,000 |
No other historical records.
51, Avon Road, Upminster RM14 1RE
| Today | See what it's worth now |
| 20 Mar 2026 | £750,000 |
| 8 Nov 2018 | £541,000 |
No other historical records.
18, Ingrebourne Gardens, Upminster RM14 1BQ
| Today | See what it's worth now |
| 19 Mar 2026 | £675,000 |
No other historical records.
57, Trent Avenue, Upminster RM14 1QY
| Today | See what it's worth now |
| 19 Mar 2026 | £575,000 |
| 10 Jul 2013 | £270,000 |
No other historical records.
4, Briarleas Gardens, Upminster RM14 1LP
| Today | See what it's worth now |
| 16 Mar 2026 | £567,000 |
No other historical records.
6, Judith Anne Court, Westbury Terrace, Upminster RM14 3ND

| Today | See what it's worth now |
| 13 Mar 2026 | £162,800 |
| 21 May 2008 | £182,500 |
No other historical records.
39, The Crescent, Upminster RM14 1JZ
| Today | See what it's worth now |
| 11 Mar 2026 | £475,000 |
No other historical records.
18, Tabrums Way, Upminster RM14 1SP
| Today | See what it's worth now |
| 6 Mar 2026 | £535,000 |
| 15 Feb 2021 | £425,000 |
No other historical records.
34, Roseberry Gardens, Upminster RM14 1NW
| Today | See what it's worth now |
| 6 Mar 2026 | £335,000 |
| 31 Aug 2016 | £237,000 |
9, Cranham Gardens, Upminster RM14 1JG
| Today | See what it's worth now |
| 5 Mar 2026 | £440,000 |
| 17 Oct 2023 | £435,000 |
21, Limerick Gardens, Upminster RM14 1HY
| Today | See what it's worth now |
| 4 Mar 2026 | £540,000 |
| 1 Jun 1999 | £132,000 |
No other historical records.
5, Kings Gardens, Upminster RM14 1LA
| Today | See what it's worth now |
| 26 Feb 2026 | £710,000 |
| 17 Aug 2016 | £527,500 |
13, Blyth Walk, Upminster RM14 1RR

| Today | See what it's worth now |
| 26 Feb 2026 | £429,500 |
| 5 Nov 2021 | £375,000 |
23, Dart Close, Upminster RM14 1PR
| Today | See what it's worth now |
| 24 Feb 2026 | £535,000 |
| 11 Sep 2015 | £420,000 |
28, Kings Gardens, Upminster RM14 1JX
| Today | See what it's worth now |
| 20 Feb 2026 | £475,000 |
| 14 Feb 2001 | £179,995 |
No other historical records.
48, St Albans Avenue, Upminster RM14 3JS
| Today | See what it's worth now |
| 20 Feb 2026 | £730,000 |
| 12 May 2023 | £545,000 |
No other historical records.
173, Roseberry Gardens, Upminster RM14 1NF

| Today | See what it's worth now |
| 20 Feb 2026 | £500,000 |
| 22 May 2015 | £325,000 |
No other historical records.
206, Moor Lane, Upminster RM14 1HQ
| Today | See what it's worth now |
| 11 Feb 2026 | £475,000 |
| 1 Apr 2020 | £390,000 |
Source Acknowledgement: © Crown copyright. England and Wales house price data is publicly available information produced by the HM Land Registry.This material was last updated on 9 July 2026. It covers the period from 1 January 1995 to 30 April 2026 and contains property transactions which have been registered during that period. Contains HM Land Registry data © Crown copyright and database right 2026. This data is licensed under the Open Government Licence v3.0.
Disclaimer: Rightmove.co.uk provides this HM Land Registry data "as is". The burden for fitness of the data relies completely with the user and is provided for informational purposes only. No warranty, express or implied, is given relating to the accuracy of content of the HM Land Registry data and Rightmove does not accept any liability for error or omission. If you have found an error with the data or need further information please contact HM Land Registry.
Permitted Use: Viewers of this Information are granted permission to access this Crown copyright material and to download it onto electronic, magnetic, optical or similar storage media provided that such activities are for private research, study or in-house use only. Any other use of the material requires the formal written permission of Land Registry which can be requested from us, and is subject to an additional licence and associated charge.
Rightmove takes no liability for your use of, or reliance on, Rightmove's Instant Valuation due to the limitations of our tracking tool listed here. Use of this tool is taken entirely at your own risk. All rights reserved.