
House Prices in DE12
House prices in DE12 have an overall average of £290,261 over the last year.
The majority of properties sold in DE12 during the last year were detached properties, selling for an average price of £388,053. Semi-detached properties sold for an average of £251,009, with terraced properties fetching £186,101.
Overall, the historical sold prices in DE12 over the last year were 2% down on the previous year and 5% down on the 2022 peak of £306,793.
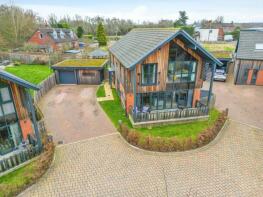
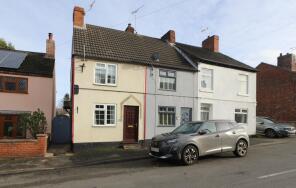
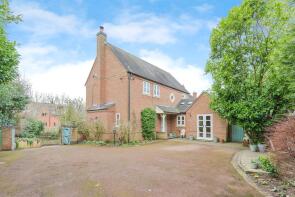
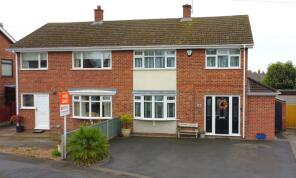
Properties Sold
78, Woodville Road, Overseal, Swadlincote DE12 6LX
| Today | See what it's worth now |
| 24 Apr 2026 | £190,000 |
| 12 Oct 2023 | £210,000 |
258, Burton Road, Overseal, Swadlincote DE12 6JN
| Today | See what it's worth now |
| 17 Apr 2026 | £275,000 |
No other historical records.
1, Iveagh Close, Swadlincote DE12 7JL
| Today | See what it's worth now |
| 13 Apr 2026 | £220,000 |
| 18 Dec 2020 | £200,000 |
No other historical records.
Extensions and planning permission in DE12
See planning approval stats, extension build costs and value added estimates.

24, Norris Hill, Swadlincote DE12 6ER
| Today | See what it's worth now |
| 8 Apr 2026 | £200,000 |
| 14 Dec 2007 | £146,250 |
No other historical records.
42, Wordsworth Way, Swadlincote DE12 7ER
| Today | See what it's worth now |
| 27 Mar 2026 | £260,000 |
| 11 Sep 2017 | £171,000 |
17, Bosworth Road, Swadlincote DE12 7LG
| Today | See what it's worth now |
| 27 Mar 2026 | £227,500 |
| 30 Mar 2022 | £190,000 |
21, Old End, Swadlincote DE12 7AG
| Today | See what it's worth now |
| 27 Mar 2026 | £910,000 |
| 14 Dec 2004 | £475,000 |
7, Parkfield Crescent, Appleby Magna DE12 7BW
| Today | See what it's worth now |
| 27 Mar 2026 | £220,000 |
No other historical records.
5, The Old Stables, Swadlincote DE12 7RZ
| Today | See what it's worth now |
| 27 Mar 2026 | £307,500 |
| 22 Nov 2021 | £300,000 |
5, Alice Gardens, Woodlands Road, Overseal, Swadlincote DE12 6LB
| Today | See what it's worth now |
| 16 Mar 2026 | £320,000 |
| 25 Oct 2002 | £126,950 |
No other historical records.
7, Hawthorn Close, Swadlincote DE12 7NF
| Today | See what it's worth now |
| 13 Mar 2026 | £310,000 |
| 26 Oct 2001 | £111,500 |
23, Woodlands Road, Overseal, Swadlincote DE12 6LS
| Today | See what it's worth now |
| 13 Mar 2026 | £220,000 |
| 28 May 2021 | £194,950 |
40, Via Devana, Swadlincote DE12 6BE
| Today | See what it's worth now |
| 12 Mar 2026 | £262,000 |
| 29 Aug 2002 | £123,950 |
No other historical records.
3, Meadow Gardens, Swadlincote DE12 7EA
| Today | See what it's worth now |
| 12 Mar 2026 | £395,000 |
| 17 Aug 2015 | £255,000 |
No other historical records.
4, Stone Row Place, Swadlincote DE12 6AY
| Today | See what it's worth now |
| 12 Mar 2026 | £612,000 |
| 6 Dec 2019 | £447,500 |
No other historical records.
53, Moira Road, Swadlincote DE12 7QD
| Today | See what it's worth now |
| 6 Mar 2026 | £162,500 |
| 23 Apr 2004 | £82,000 |
11, Coton Road, Walton-on-trent, Swadlincote DE12 8NL
| Today | See what it's worth now |
| 6 Mar 2026 | £585,000 |
| 22 Jul 2009 | £325,000 |
5, Glebe Close, Coton-in-the-elms, Swadlincote DE12 8HF
| Today | See what it's worth now |
| 6 Mar 2026 | £265,000 |
| 2 Jul 2024 | £235,000 |
40, Iveagh Close, Swadlincote DE12 7JL
| Today | See what it's worth now |
| 3 Mar 2026 | £257,000 |
| 22 Nov 2013 | £146,000 |
5, School Street, Swadlincote DE12 7RE
| Today | See what it's worth now |
| 2 Mar 2026 | £200,000 |
| 27 May 2022 | £175,000 |
58, Main Street, Walton-on-trent, Swadlincote DE12 8LZ

| Today | See what it's worth now |
| 27 Feb 2026 | £650,000 |
| 11 Dec 2020 | £575,000 |
No other historical records.
3, Mannings Terrace, Swadlincote DE12 7HU

| Today | See what it's worth now |
| 27 Feb 2026 | £120,000 |
| 20 Oct 2014 | £101,000 |
57, Top Street, Swadlincote DE12 7AH
| Today | See what it's worth now |
| 26 Feb 2026 | £600,000 |
| 31 Jan 2020 | £360,000 |
No other historical records.
Source Acknowledgement: © Crown copyright. England and Wales house price data is publicly available information produced by the HM Land Registry.This material was last updated on 9 July 2026. It covers the period from 1 January 1995 to 30 April 2026 and contains property transactions which have been registered during that period. Contains HM Land Registry data © Crown copyright and database right 2026. This data is licensed under the Open Government Licence v3.0.
Disclaimer: Rightmove.co.uk provides this HM Land Registry data "as is". The burden for fitness of the data relies completely with the user and is provided for informational purposes only. No warranty, express or implied, is given relating to the accuracy of content of the HM Land Registry data and Rightmove does not accept any liability for error or omission. If you have found an error with the data or need further information please contact HM Land Registry.
Permitted Use: Viewers of this Information are granted permission to access this Crown copyright material and to download it onto electronic, magnetic, optical or similar storage media provided that such activities are for private research, study or in-house use only. Any other use of the material requires the formal written permission of Land Registry which can be requested from us, and is subject to an additional licence and associated charge.
Rightmove takes no liability for your use of, or reliance on, Rightmove's Instant Valuation due to the limitations of our tracking tool listed here. Use of this tool is taken entirely at your own risk. All rights reserved.