
House Prices in Drighlington
House prices in Drighlington have an overall average of £284,435 over the last year.
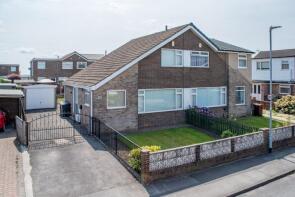
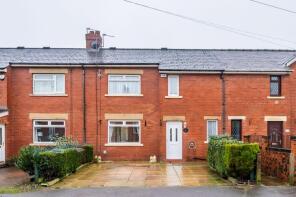
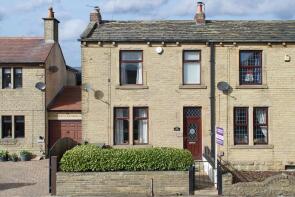
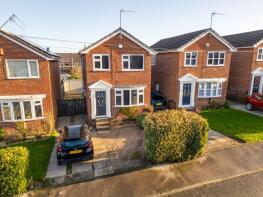
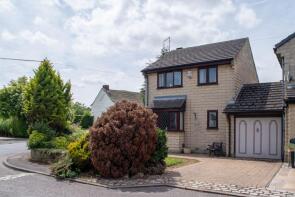
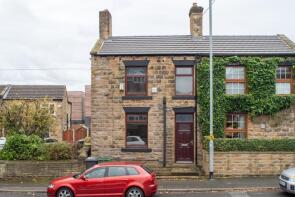
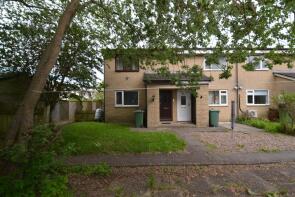
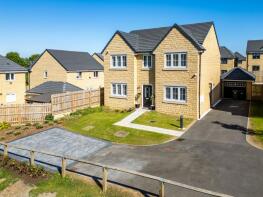
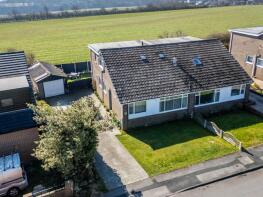
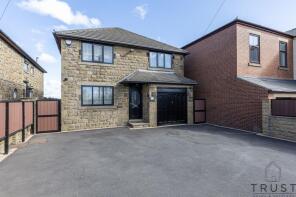
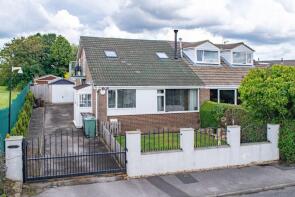
The majority of properties sold in Drighlington during the last year were semi-detached properties, selling for an average price of £261,901. Detached properties sold for an average of £392,724, with terraced properties fetching £201,573.
Overall, the historical sold prices in Drighlington over the last year were 3% down on the previous year and 1% down on the 2023 peak of £288,659.
Properties Sold
12, Moorside Avenue, Drighlington, Bradford BD11 1HH
| Today | See what it's worth now |
| 27 Mar 2026 | £244,000 |
| 7 Oct 2021 | £150,000 |
21, Whitehall Grove, Drighlington, Bradford BD11 1BG
| Today | See what it's worth now |
| 26 Mar 2026 | £175,000 |
| 14 Jan 2002 | £13,500 |
No other historical records.
330, Whitehall Road, Drighlington, Bradford BD11 1BD
| Today | See what it's worth now |
| 20 Mar 2026 | £177,000 |
| 7 May 2019 | £150,000 |
6, Moorside Vale, Drighlington, Bradford BD11 1DW
| Today | See what it's worth now |
| 17 Mar 2026 | £255,000 |
| 13 Sep 2002 | £110,000 |
No other historical records.
1, Jubilee Croft, Drighlington, Bradford BD11 1LZ
| Today | See what it's worth now |
| 13 Mar 2026 | £274,000 |
No other historical records.
33, Cavendish Court, West Street, Drighlington, Bradford BD11 1DA
| Today | See what it's worth now |
| 4 Mar 2026 | £190,500 |
| 2 Dec 2022 | £180,000 |
228, Wakefield Road, Drighlington, Bradford BD11 1ED
| Today | See what it's worth now |
| 26 Feb 2026 | £120,000 |
No other historical records.
24, Adwalton Close, Drighlington, Bradford BD11 1DQ
| Today | See what it's worth now |
| 20 Feb 2026 | £112,000 |
| 1 Mar 2023 | £89,950 |
No other historical records.
10, Back Lane, Drighlington, Bradford BD11 1LS

| Today | See what it's worth now |
| 13 Feb 2026 | £117,500 |
| 27 Mar 1997 | £29,950 |
No other historical records.
102, Wakefield Road, Drighlington, Bradford BD11 1DR
| Today | See what it's worth now |
| 26 Jan 2026 | £189,950 |
| 30 Jun 2020 | £146,000 |
31, Moorside Terrace, Drighlington, Bradford BD11 1HX
| Today | See what it's worth now |
| 9 Jan 2026 | £280,000 |
| 4 Jan 2019 | £185,000 |
4, Moorside View, Drighlington, Bradford BD11 1HN
| Today | See what it's worth now |
| 9 Jan 2026 | £280,000 |
| 10 May 2007 | £158,000 |
No other historical records.
43, Dean Park Drive, Drighlington, Bradford BD11 1AL
| Today | See what it's worth now |
| 9 Jan 2026 | £242,000 |
| 26 Mar 2021 | £190,000 |
No other historical records.
43, Station Road, Drighlington, Bradford BD11 1JU
| Today | See what it's worth now |
| 9 Jan 2026 | £233,000 |
| 27 Oct 2023 | £203,499 |
5, Driftholme Road, Drighlington, Bradford BD11 1LR
| Today | See what it's worth now |
| 19 Dec 2025 | £249,950 |
| 12 Dec 2019 | £162,950 |
26, Cavendish Court, West Street, Drighlington, Bradford BD11 1DA
| Today | See what it's worth now |
| 19 Dec 2025 | £75,000 |
| 28 May 2021 | £72,000 |
26, Summerbank Close, Drighlington, Bradford BD11 1LQ
| Today | See what it's worth now |
| 16 Dec 2025 | £205,000 |
| 21 Oct 2005 | £138,125 |
No other historical records.
2, Bowling Green View, Drighlington, Bradford BD11 1JP

| Today | See what it's worth now |
| 12 Dec 2025 | £385,000 |
| 25 Oct 2002 | £179,950 |
No other historical records.
87, Whitehall Road, Drighlington, Bradford BD11 1LN
| Today | See what it's worth now |
| 5 Dec 2025 | £285,000 |
| 12 May 2017 | £167,500 |
34, Juniper Crescent, Drighlington, Bradford BD11 1FR
| Today | See what it's worth now |
| 4 Dec 2025 | £548,000 |
| 28 Jun 2023 | £415,995 |
No other historical records.
16, Moorside View, Drighlington, Bradford BD11 1HN
| Today | See what it's worth now |
| 2 Dec 2025 | £292,500 |
No other historical records.
183, Wakefield Road, Drighlington, Bradford BD11 1EB
| Today | See what it's worth now |
| 1 Dec 2025 | £575,000 |
| 30 Jun 2022 | £452,000 |
1, Moorside View, Drighlington, Bradford BD11 1HN
| Today | See what it's worth now |
| 27 Nov 2025 | £295,000 |
| 9 Oct 2015 | £140,000 |
No other historical records.
Source Acknowledgement: © Crown copyright. England and Wales house price data is publicly available information produced by the HM Land Registry.This material was last updated on 9 July 2026. It covers the period from 1 January 1995 to 30 April 2026 and contains property transactions which have been registered during that period. Contains HM Land Registry data © Crown copyright and database right 2026. This data is licensed under the Open Government Licence v3.0.
Disclaimer: Rightmove.co.uk provides this HM Land Registry data "as is". The burden for fitness of the data relies completely with the user and is provided for informational purposes only. No warranty, express or implied, is given relating to the accuracy of content of the HM Land Registry data and Rightmove does not accept any liability for error or omission. If you have found an error with the data or need further information please contact HM Land Registry.
Permitted Use: Viewers of this Information are granted permission to access this Crown copyright material and to download it onto electronic, magnetic, optical or similar storage media provided that such activities are for private research, study or in-house use only. Any other use of the material requires the formal written permission of Land Registry which can be requested from us, and is subject to an additional licence and associated charge.
Rightmove takes no liability for your use of, or reliance on, Rightmove's Instant Valuation due to the limitations of our tracking tool listed here. Use of this tool is taken entirely at your own risk. All rights reserved.