
House Prices in Tong
House prices in Tong have an overall average of £174,344 over the last year.
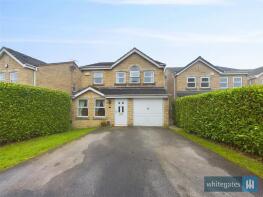
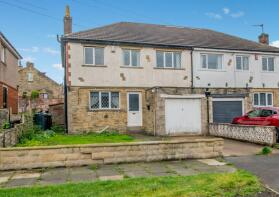
The majority of properties sold in Tong during the last year were detached properties, selling for an average price of £229,773. Semi-detached properties sold for an average of £182,773, with terraced properties fetching £99,555.
Overall, the historical sold prices in Tong over the last year were 7% up on the previous year and similar to the 2015 peak of £175,905.
Properties Sold
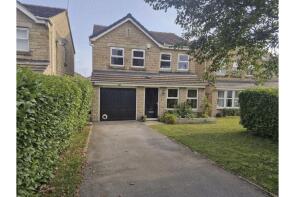
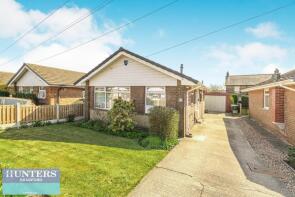
40, Moorcroft Drive, Tong, Bradford BD4 6NJ
| Today | See what it's worth now |
| 17 Apr 2026 | £227,000 |
| 10 Apr 2017 | £148,000 |
12, Broadstone Way, Bradford BD4 9RX
| Today | See what it's worth now |
| 31 Mar 2026 | £110,000 |
| 30 Nov 2007 | £89,950 |
49, Royd Moor Road, Tong, Bradford BD4 0TR
| Today | See what it's worth now |
| 26 Mar 2026 | £195,000 |
| 26 Feb 2021 | £147,000 |
35, Denbrook Avenue, Tong, Bradford BD4 0QJ
| Today | See what it's worth now |
| 17 Mar 2026 | £215,000 |
| 6 Mar 2020 | £160,000 |
No other historical records.
22, Montserrat Road, Tong, Bradford BD4 0QB
| Today | See what it's worth now |
| 10 Mar 2026 | £179,000 |
| 23 Nov 2016 | £100,000 |
5, Horsman Street, Bradford BD4 9QZ
| Today | See what it's worth now |
| 4 Mar 2026 | £39,999 |
| 14 Jul 2004 | £28,500 |
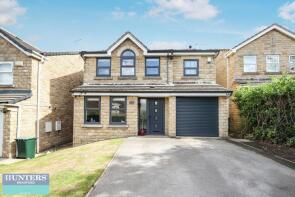
17, Goosedale Court, Tong, Bradford BD4 0TT
| Today | See what it's worth now |
| 2 Mar 2026 | £275,000 |
| 17 Jan 2020 | £215,000 |
48, Montserrat Road, Tong, Bradford BD4 0QB
| Today | See what it's worth now |
| 26 Feb 2026 | £280,000 |
| 25 Apr 2014 | £132,500 |
No other historical records.
12, Chilver Drive, Tong, Bradford BD4 0TS
| Today | See what it's worth now |
| 30 Jan 2026 | £310,000 |
| 12 Feb 2021 | £215,000 |
36, Royd Moor Road, Tong, Bradford BD4 0TR
| Today | See what it's worth now |
| 16 Jan 2026 | £150,000 |
| 21 Sep 2022 | £143,350 |
69, Holme Lane, Bradford BD4 0PU
| Today | See what it's worth now |
| 19 Dec 2025 | £68,500 |
| 24 Nov 2006 | £57,500 |
11, Vulcan Street, Bradford BD4 9QU
| Today | See what it's worth now |
| 2 Dec 2025 | £115,500 |
| 18 Oct 2013 | £79,950 |
No other historical records.
15, Royd Moor Road, Tong, Bradford BD4 0TR
| Today | See what it's worth now |
| 2 Dec 2025 | £165,000 |
| 1 Dec 2016 | £110,000 |
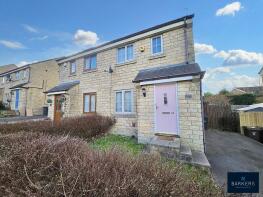
110, Denbrook Avenue, Tong, Bradford BD4 0QN
| Today | See what it's worth now |
| 3 Nov 2025 | £185,000 |
| 2 Oct 2004 | £82,000 |
28, Moorcroft Drive, Tong, Bradford BD4 6NJ
| Today | See what it's worth now |
| 28 Oct 2025 | £135,000 |
| 26 Jan 2015 | £77,000 |
37, Montserrat Road, Tong, Bradford BD4 0QB
| Today | See what it's worth now |
| 17 Oct 2025 | £190,000 |
| 19 Dec 2019 | £119,000 |
No other historical records.
15, Goosedale Court, Tong, Bradford BD4 0TT
| Today | See what it's worth now |
| 10 Oct 2025 | £285,000 |
| 29 Nov 2002 | £137,500 |
33, Denbrook Avenue, Tong, Bradford BD4 0QJ
| Today | See what it's worth now |
| 7 Oct 2025 | £193,000 |
| 27 Jul 2000 | £63,500 |
No other historical records.
12, Ring Hay Road, Tong, Bradford BD4 0TZ

| Today | See what it's worth now |
| 6 Oct 2025 | £230,000 |
| 30 Jul 2004 | £147,000 |
Apartment 2, Stonelea, North View Road, East Bierley, Bradford BD4 6NS
| Today | See what it's worth now |
| 30 Sep 2025 | £145,000 |
| 30 Jul 2021 | £121,500 |
375, Tong Street, Bradford BD4 9RU
| Today | See what it's worth now |
| 29 Aug 2025 | £95,000 |
| 14 Feb 2006 | £71,500 |
No other historical records.
22a, Cordingley Street, Bradford BD4 0PP
| Today | See what it's worth now |
| 28 Aug 2025 | £200,000 |
| 13 Jan 2022 | £155,000 |
16, Royd Moor Road, Tong, Bradford BD4 0TR
| Today | See what it's worth now |
| 27 Aug 2025 | £226,500 |
| 22 Feb 2019 | £147,000 |
Source Acknowledgement: © Crown copyright. England and Wales house price data is publicly available information produced by the HM Land Registry.This material was last updated on 9 July 2026. It covers the period from 1 January 1995 to 30 April 2026 and contains property transactions which have been registered during that period. Contains HM Land Registry data © Crown copyright and database right 2026. This data is licensed under the Open Government Licence v3.0.
Disclaimer: Rightmove.co.uk provides this HM Land Registry data "as is". The burden for fitness of the data relies completely with the user and is provided for informational purposes only. No warranty, express or implied, is given relating to the accuracy of content of the HM Land Registry data and Rightmove does not accept any liability for error or omission. If you have found an error with the data or need further information please contact HM Land Registry.
Permitted Use: Viewers of this Information are granted permission to access this Crown copyright material and to download it onto electronic, magnetic, optical or similar storage media provided that such activities are for private research, study or in-house use only. Any other use of the material requires the formal written permission of Land Registry which can be requested from us, and is subject to an additional licence and associated charge.
Rightmove takes no liability for your use of, or reliance on, Rightmove's Instant Valuation due to the limitations of our tracking tool listed here. Use of this tool is taken entirely at your own risk. All rights reserved.