
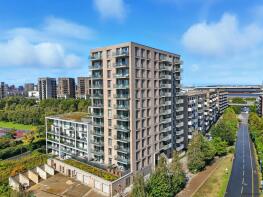
House Prices in E16
House prices in E16 have an overall average of £429,659 over the last year.
The majority of properties sold in E16 during the last year were flats, selling for an average price of £425,796. Terraced properties sold for an average of £454,772, with semi-detached properties fetching £468,750.
Overall, the historical sold prices in E16 over the last year were 11% down on the previous year and 11% down on the 2021 peak of £481,404.
Properties Sold
Flat 1, Brocklebank House, Glenister Street, North Woolwich, London E16 2LY

| Today | See what it's worth now |
| 21 Apr 2026 | £192,000 |
| 24 Jul 2015 | £155,000 |
No other historical records.
Flat 18, 3 Warehouse W, Western Gateway, Canning Town, London E16 1BD

| Today | See what it's worth now |
| 20 Apr 2026 | £397,000 |
| 15 Feb 2007 | £695,000 |
No other historical records.
59, 16 Waterside Heights, Booth Road, Silvertown, London E16 2GP
| Today | See what it's worth now |
| 17 Apr 2026 | £375,000 |
| 22 Aug 2014 | £411,000 |
No other historical records.
Extensions and planning permission in E16
See planning approval stats, extension build costs and value added estimates.

Flat 122, 18 The Oxygen, Western Gateway, Canning Town, London E16 1BQ
| Today | See what it's worth now |
| 10 Apr 2026 | £675,000 |
| 24 Dec 2008 | £296,000 |
No other historical records.
Flat 1, Munnings House, Portsmouth Mews, Silvertown, London E16 1UJ
| Today | See what it's worth now |
| 7 Apr 2026 | £315,000 |
| 16 Feb 2007 | £245,000 |
Flat 97, 18 The Oxygen, Western Gateway, Canning Town, London E16 1BQ

| Today | See what it's worth now |
| 2 Apr 2026 | £560,000 |
| 17 Jun 2021 | £575,000 |
Flat 39, 1, Bywell Place, Canning Town, London E16 1JW
| Today | See what it's worth now |
| 2 Apr 2026 | £385,000 |
| 11 Mar 2015 | £380,000 |
No other historical records.
Apartment 201, 12b Galleria House, Western Gateway, Canning Town, London E16 1BB
| Today | See what it's worth now |
| 2 Apr 2026 | £385,000 |
| 21 Apr 2023 | £437,475 |
No other historical records.
191, Barrier Point Road, Silvertown, London E16 2SF

| Today | See what it's worth now |
| 31 Mar 2026 | £450,000 |
| 8 Oct 2007 | £395,000 |
Flat 2, 101 103, Barking Road, Canning Town, London E16 4HQ

| Today | See what it's worth now |
| 31 Mar 2026 | £190,000 |
| 1 Feb 2018 | £199,950 |
No other historical records.
Flat 16, 147 Sky Studios, Albert Road, North Woolwich, London E16 2JG
| Today | See what it's worth now |
| 26 Mar 2026 | £252,000 |
| 13 Jul 2007 | £249,995 |
18, Vandome Close, Canning Town, London E16 3SA
| Today | See what it's worth now |
| 26 Mar 2026 | £250,000 |
| 28 Jul 2017 | £220,000 |
No other historical records.
24, Mafeking Road, Canning Town, London E16 4NS
| Today | See what it's worth now |
| 26 Mar 2026 | £425,000 |
| 27 Jan 2006 | £200,000 |
11, Fleetwood Close, Beckton, London E16 3SN

| Today | See what it's worth now |
| 25 Mar 2026 | £415,000 |
| 18 Mar 2016 | £340,000 |
No other historical records.
Flat 46, 17 Coral Apartments, Western Gateway, Canning Town, London E16 1AQ

| Today | See what it's worth now |
| 24 Mar 2026 | £590,000 |
| 7 Dec 2020 | £590,000 |
Flat 1, 3 Georgian House, Capulet Mews, Silvertown, London E16 1SQ
| Today | See what it's worth now |
| 20 Mar 2026 | £395,000 |
| 30 Mar 2016 | £390,000 |
Flat 202, 1 Drift Court, Basin Approach, Beckton, London E16 2FE

| Today | See what it's worth now |
| 20 Mar 2026 | £355,000 |
| 20 Dec 2010 | £240,000 |
No other historical records.
Flat 18, 50 Pioneer Court, Hammersley Road, Canning Town, London E16 1RA
| Today | See what it's worth now |
| 20 Mar 2026 | £330,000 |
| 31 Mar 2017 | £390,000 |
No other historical records.
Apartment 1406, 3, Tidal Basin Road, Silvertown, London E16 1UX

| Today | See what it's worth now |
| 20 Mar 2026 | £570,000 |
| 7 Dec 2016 | £512,275 |
No other historical records.
80, 6 Marco Polo Tower, Bonnet Street, Silvertown, London E16 2BN
| Today | See what it's worth now |
| 20 Mar 2026 | £400,000 |
| 29 Mar 2021 | £471,625 |
No other historical records.
Flat 601, 4 The Helm, Basin Approach, Beckton, London E16 2QX

| Today | See what it's worth now |
| 20 Mar 2026 | £273,000 |
| 18 Jan 2008 | £380,000 |
No other historical records.
80, 4 James Cook Building, Bonnet Street, Silvertown, London E16 2YY

| Today | See what it's worth now |
| 19 Mar 2026 | £540,000 |
| 19 Feb 2021 | £600,000 |
No other historical records.
Flat 604, 3 The Galley, Basin Approach, Beckton, London E16 2QW
| Today | See what it's worth now |
| 17 Mar 2026 | £220,000 |
| 21 Jul 2008 | £265,000 |
No other historical records.

Source Acknowledgement: © Crown copyright. England and Wales house price data is publicly available information produced by the HM Land Registry.This material was last updated on 9 July 2026. It covers the period from 1 January 1995 to 30 April 2026 and contains property transactions which have been registered during that period. Contains HM Land Registry data © Crown copyright and database right 2026. This data is licensed under the Open Government Licence v3.0.
Disclaimer: Rightmove.co.uk provides this HM Land Registry data "as is". The burden for fitness of the data relies completely with the user and is provided for informational purposes only. No warranty, express or implied, is given relating to the accuracy of content of the HM Land Registry data and Rightmove does not accept any liability for error or omission. If you have found an error with the data or need further information please contact HM Land Registry.
Permitted Use: Viewers of this Information are granted permission to access this Crown copyright material and to download it onto electronic, magnetic, optical or similar storage media provided that such activities are for private research, study or in-house use only. Any other use of the material requires the formal written permission of Land Registry which can be requested from us, and is subject to an additional licence and associated charge.
Rightmove takes no liability for your use of, or reliance on, Rightmove's Instant Valuation due to the limitations of our tracking tool listed here. Use of this tool is taken entirely at your own risk. All rights reserved.