
House Prices in Earlham
House prices in Earlham have an overall average of £337,415 over the last year.
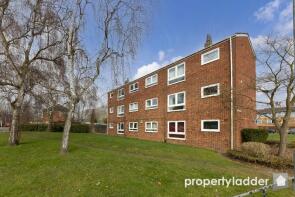
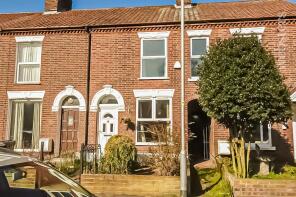
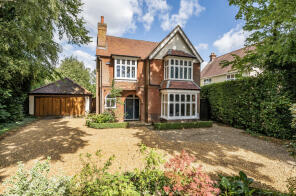
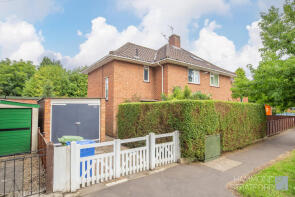
The majority of properties sold in Earlham during the last year were detached properties, selling for an average price of £472,682. Semi-detached properties sold for an average of £354,292, with flats fetching £186,275.
Overall, the historical sold prices in Earlham over the last year were 11% down on the previous year and 9% down on the 2023 peak of £370,216.
Properties Sold
41, Almond Drive, Norwich NR4 7TB
| Today | See what it's worth now |
| 23 Apr 2026 | £315,000 |
| 14 Jun 2017 | £272,000 |
No other historical records.
9, Rose Drive, Norwich NR4 7SZ
| Today | See what it's worth now |
| 17 Apr 2026 | £415,000 |
| 30 Jun 2015 | £295,000 |
No other historical records.
7, Honeysuckle Close, Norwich NR4 7SY
| Today | See what it's worth now |
| 14 Apr 2026 | £342,500 |
| 30 Jun 2015 | £247,950 |
No other historical records.
35, Melrose Road, Norwich NR4 7PN

| Today | See what it's worth now |
| 10 Apr 2026 | £300,000 |
| 9 Apr 2018 | £200,000 |
No other historical records.
89, Almond Drive, Norwich NR4 7TB
| Today | See what it's worth now |
| 8 Apr 2026 | £275,000 |
| 16 Dec 2016 | £232,746 |
No other historical records.
131, Buckingham Road, Norwich NR4 7DG
| Today | See what it's worth now |
| 20 Mar 2026 | £300,000 |
| 1 Sep 2020 | £260,000 |
No other historical records.
60, Dragonfly Lane, Norwich NR4 7JR
| Today | See what it's worth now |
| 19 Mar 2026 | £330,000 |
| 29 Oct 2015 | £230,000 |
No other historical records.
18, Dunlin Drive, Norwich NR4 7PX
| Today | See what it's worth now |
| 27 Feb 2026 | £405,000 |
| 7 Dec 2012 | £269,995 |
No other historical records.
28, Uplands Court, Upton Road, Norwich NR4 7PH
| Today | See what it's worth now |
| 25 Feb 2026 | £150,000 |
| 29 Sep 2017 | £161,000 |
No other historical records.
10, Sotherton Road, Norwich NR4 7DB
| Today | See what it's worth now |
| 25 Feb 2026 | £266,000 |
| 8 Jun 2007 | £178,133 |
218, Northfields, Norwich NR4 7EX
| Today | See what it's worth now |
| 16 Feb 2026 | £150,000 |
| 14 Jun 2006 | £118,000 |
No other historical records.
35, Buckingham Road, Norwich NR4 7DE
| Today | See what it's worth now |
| 13 Feb 2026 | £322,500 |
| 10 Jun 2005 | £167,500 |
12, Caroline Court, Norwich NR4 7EJ
| Today | See what it's worth now |
| 12 Feb 2026 | £377,000 |
| 16 Oct 2015 | £240,000 |
No other historical records.
31, Osborne Road, Norwich NR4 7BW
| Today | See what it's worth now |
| 11 Feb 2026 | £167,500 |
| 27 Sep 2007 | £123,500 |
No other historical records.
5, Sycamore Court, Norwich NR4 7EW
| Today | See what it's worth now |
| 11 Feb 2026 | £385,000 |
| 27 Feb 2015 | £249,995 |
No other historical records.
1b Mistral, Poplar Avenue, Norwich NR4 7LB
| Today | See what it's worth now |
| 2 Feb 2026 | £520,000 |
| 12 Oct 2007 | £395,000 |
No other historical records.
85, Leng Crescent, Norwich NR4 7NZ
| Today | See what it's worth now |
| 29 Jan 2026 | £340,000 |
| 13 Feb 2018 | £252,500 |
32, Bluebell Road, Norwich NR4 7LG

| Today | See what it's worth now |
| 29 Jan 2026 | £575,000 |
| 29 Nov 2010 | £339,000 |
6, Leopold Road, Norwich NR4 7AD
| Today | See what it's worth now |
| 26 Jan 2026 | £542,000 |
| 9 May 2023 | £417,000 |
15, Northfields, Norwich NR4 7ES
| Today | See what it's worth now |
| 23 Jan 2026 | £118,000 |
No other historical records.
60, Waldeck Road, Norwich NR4 7PQ
| Today | See what it's worth now |
| 21 Jan 2026 | £250,000 |
| 17 Apr 2007 | £160,000 |
363, Unthank Road, Norwich NR4 7QG
| Today | See what it's worth now |
| 20 Jan 2026 | £1,077,000 |
| 16 Aug 2012 | £695,000 |
No other historical records.
63, Woolhouse Way, Norwich NR4 7FX
| Today | See what it's worth now |
| 9 Jan 2026 | £570,000 |
No other historical records.
Source Acknowledgement: © Crown copyright. England and Wales house price data is publicly available information produced by the HM Land Registry.This material was last updated on 9 July 2026. It covers the period from 1 January 1995 to 30 April 2026 and contains property transactions which have been registered during that period. Contains HM Land Registry data © Crown copyright and database right 2026. This data is licensed under the Open Government Licence v3.0.
Disclaimer: Rightmove.co.uk provides this HM Land Registry data "as is". The burden for fitness of the data relies completely with the user and is provided for informational purposes only. No warranty, express or implied, is given relating to the accuracy of content of the HM Land Registry data and Rightmove does not accept any liability for error or omission. If you have found an error with the data or need further information please contact HM Land Registry.
Permitted Use: Viewers of this Information are granted permission to access this Crown copyright material and to download it onto electronic, magnetic, optical or similar storage media provided that such activities are for private research, study or in-house use only. Any other use of the material requires the formal written permission of Land Registry which can be requested from us, and is subject to an additional licence and associated charge.
Rightmove takes no liability for your use of, or reliance on, Rightmove's Instant Valuation due to the limitations of our tracking tool listed here. Use of this tool is taken entirely at your own risk. All rights reserved.