
House Prices in Estover
House prices in Estover have an overall average of £235,975 over the last year.
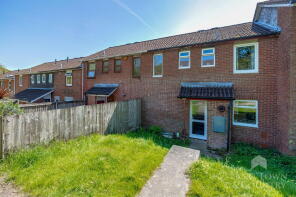
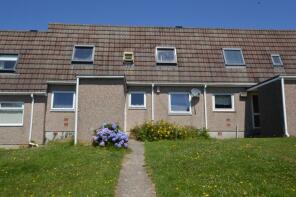
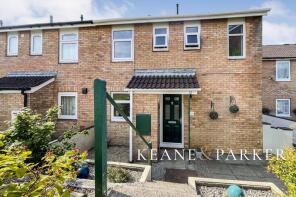
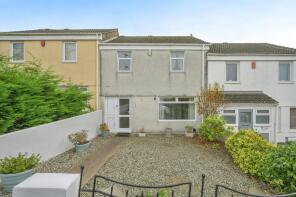
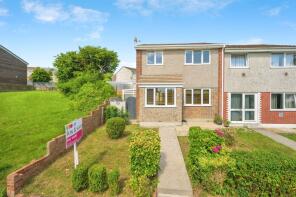
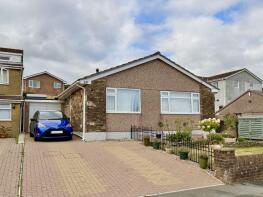
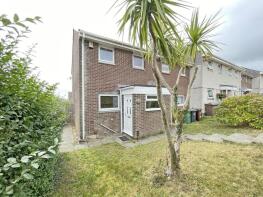
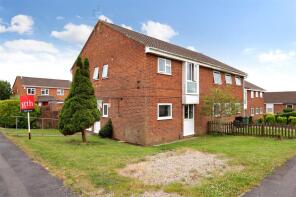
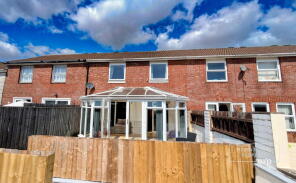
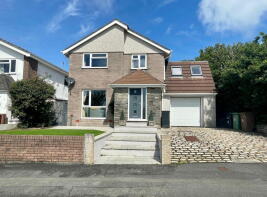
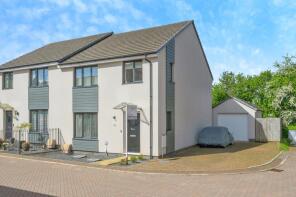
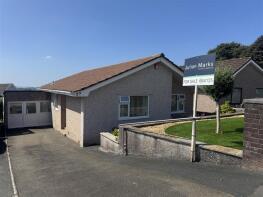
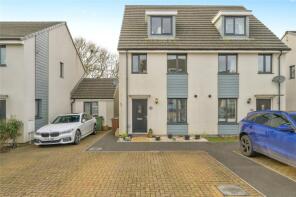
The majority of properties sold in Estover during the last year were terraced properties, selling for an average price of £217,556. Semi-detached properties sold for an average of £244,167, with detached properties fetching £356,250.
Overall, the historical sold prices in Estover over the last year were 8% up on the previous year and 9% up on the 2022 peak of £216,375.
Properties Sold
11, Kinver Close, Plymouth PL6 8TY
| Today | See what it's worth now |
| 30 Mar 2026 | £354,000 |
No other historical records.
16, Walcot Close, Plymouth PL6 8TG
| Today | See what it's worth now |
| 18 Mar 2026 | £205,000 |
| 19 Nov 1999 | £46,500 |
No other historical records.
59, Rheola Gardens, Plymouth PL6 8UB
| Today | See what it's worth now |
| 6 Mar 2026 | £255,000 |
| 9 Aug 2004 | £129,995 |
No other historical records.
123, Wythburn Gardens, Plymouth PL6 8TH
| Today | See what it's worth now |
| 27 Feb 2026 | £184,000 |
No other historical records.
59, Penrith Gardens, Plymouth PL6 8UX
| Today | See what it's worth now |
| 13 Feb 2026 | £182,500 |
No other historical records.
61, Rydal Close, Plymouth PL6 8TR
| Today | See what it's worth now |
| 13 Feb 2026 | £205,000 |
| 23 Mar 2018 | £157,000 |
No other historical records.
59, Wentwood Gardens, Plymouth PL6 8TD
| Today | See what it's worth now |
| 30 Jan 2026 | £256,000 |
| 22 Mar 2002 | £89,950 |
No other historical records.
32, Yewdale Gardens, Plymouth PL6 8TJ
| Today | See what it's worth now |
| 23 Jan 2026 | £230,000 |
| 27 Jul 2020 | £167,000 |
250, Miller Way, Plymouth PL6 8UQ
| Today | See what it's worth now |
| 23 Jan 2026 | £210,000 |
| 26 Nov 2007 | £137,000 |
23, Penrith Close, Plymouth PL6 8UY
| Today | See what it's worth now |
| 15 Jan 2026 | £226,000 |
| 8 Nov 2017 | £157,000 |
No other historical records.
108, Keswick Crescent, Plymouth PL6 8TS
| Today | See what it's worth now |
| 12 Jan 2026 | £217,500 |
No other historical records.
52, Dover Road, Plymouth PL6 8ST
| Today | See what it's worth now |
| 19 Dec 2025 | £245,000 |
| 10 Jun 2021 | £220,000 |
No other historical records.
15, Combley Drive, Plymouth PL6 8JW
| Today | See what it's worth now |
| 10 Dec 2025 | £335,000 |
| 22 Jun 2021 | £270,000 |
20, Findon Gardens, Plymouth PL6 8TA
| Today | See what it's worth now |
| 26 Nov 2025 | £220,000 |
| 3 Feb 2017 | £150,000 |
1, Wentwood Place, Plymouth PL6 8TF
| Today | See what it's worth now |
| 25 Nov 2025 | £148,000 |
| 12 Jun 2015 | £108,000 |
No other historical records.
34, Penrith Close, Plymouth PL6 8UY
| Today | See what it's worth now |
| 20 Nov 2025 | £240,000 |
| 7 Dec 2016 | £159,950 |
30, Ambleside Place, Plymouth PL6 8EN
| Today | See what it's worth now |
| 7 Nov 2025 | £114,000 |
No other historical records.
6, Combley Drive, Plymouth PL6 8JW
| Today | See what it's worth now |
| 10 Oct 2025 | £450,000 |
| 16 Jun 2006 | £220,000 |
9, Rydal Close, Plymouth PL6 8TR
| Today | See what it's worth now |
| 10 Oct 2025 | £245,000 |
| 9 Feb 2007 | £134,500 |
No other historical records.
18, Ambleside Place, Plymouth PL6 8EN
| Today | See what it's worth now |
| 3 Oct 2025 | £335,000 |
| 7 Nov 2017 | £255,000 |
No other historical records.
29, Combley Drive, Plymouth PL6 8JW
| Today | See what it's worth now |
| 29 Sep 2025 | £345,000 |
| 17 Jan 2007 | £210,000 |
21, Durris Close, Plymouth PL6 8JP

| Today | See what it's worth now |
| 12 Sep 2025 | £391,000 |
No other historical records.
11, Ambleside Place, Plymouth PL6 8EN
| Today | See what it's worth now |
| 27 Aug 2025 | £290,000 |
| 22 Sep 2017 | £230,000 |
No other historical records.
Source Acknowledgement: © Crown copyright. England and Wales house price data is publicly available information produced by the HM Land Registry.This material was last updated on 9 July 2026. It covers the period from 1 January 1995 to 30 April 2026 and contains property transactions which have been registered during that period. Contains HM Land Registry data © Crown copyright and database right 2026. This data is licensed under the Open Government Licence v3.0.
Disclaimer: Rightmove.co.uk provides this HM Land Registry data "as is". The burden for fitness of the data relies completely with the user and is provided for informational purposes only. No warranty, express or implied, is given relating to the accuracy of content of the HM Land Registry data and Rightmove does not accept any liability for error or omission. If you have found an error with the data or need further information please contact HM Land Registry.
Permitted Use: Viewers of this Information are granted permission to access this Crown copyright material and to download it onto electronic, magnetic, optical or similar storage media provided that such activities are for private research, study or in-house use only. Any other use of the material requires the formal written permission of Land Registry which can be requested from us, and is subject to an additional licence and associated charge.
Rightmove takes no liability for your use of, or reliance on, Rightmove's Instant Valuation due to the limitations of our tracking tool listed here. Use of this tool is taken entirely at your own risk. All rights reserved.