
House Prices in FY3
House prices in FY3 have an overall average of £158,339 over the last year.
The majority of properties sold in FY3 during the last year were semi-detached properties, selling for an average price of £161,122. Terraced properties sold for an average of £126,447, with detached properties fetching £303,182.
Overall, the historical sold prices in FY3 over the last year were 3% down on the previous year and 3% up on the 2022 peak of £154,343.
Properties Sold
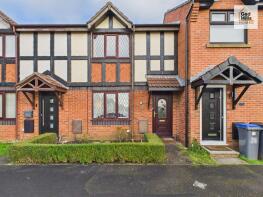
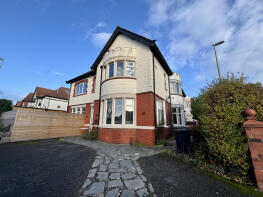
27, Bideford Avenue, Blackpool FY3 8PU
| Today | See what it's worth now |
| 24 Apr 2026 | £147,000 |
| 20 Jul 2020 | £127,000 |
No other historical records.
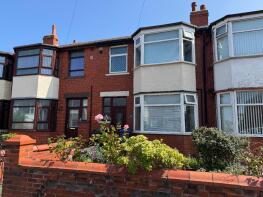
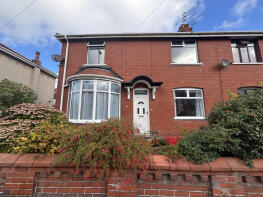
34, St Leonards Road, Blackpool FY3 9RF
| Today | See what it's worth now |
| 14 Apr 2026 | £120,000 |
| 8 Jul 2009 | £90,000 |
No other historical records.
Flat 7, 50 Grizedale Court, Forest Gate, Blackpool FY3 9AP

| Today | See what it's worth now |
| 14 Apr 2026 | £63,500 |
| 25 Jan 2017 | £40,000 |
Extensions and planning permission in FY3
See planning approval stats, extension build costs and value added estimates.

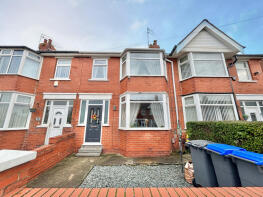
7, Garrick Grove, Blackpool FY3 7DD

| Today | See what it's worth now |
| 10 Apr 2026 | £111,000 |
| 26 Feb 2021 | £72,500 |
77, Worcester Road, Blackpool FY3 9SY
| Today | See what it's worth now |
| 2 Apr 2026 | £191,000 |
| 22 Dec 2014 | £115,000 |
5, Tyne Avenue, Blackpool FY3 9DR
| Today | See what it's worth now |
| 2 Apr 2026 | £85,000 |
| 16 Dec 1998 | £33,950 |
No other historical records.
110, Whitegate Drive, Blackpool FY3 9BY
| Today | See what it's worth now |
| 2 Apr 2026 | £205,000 |
| 28 Mar 2024 | £155,000 |
30, Marlborough Road, Blackpool FY3 9DX
| Today | See what it's worth now |
| 2 Apr 2026 | £144,000 |
| 17 Feb 2025 | £135,000 |
No other historical records.
40, Lakeway, Blackpool FY3 8PF
| Today | See what it's worth now |
| 2 Apr 2026 | £157,000 |
| 12 Feb 2016 | £116,750 |
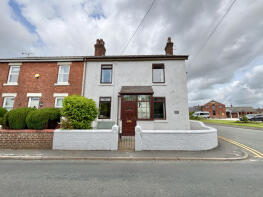
255, Staining Road, Staining FY3 0BW
| Today | See what it's worth now |
| 1 Apr 2026 | £134,500 |
| 29 Jun 2022 | £110,000 |
30, Avenue Road, Blackpool FY3 7SG

| Today | See what it's worth now |
| 1 Apr 2026 | £136,500 |
| 2 Oct 2009 | £115,000 |
85, St Leonards Road, Blackpool FY3 9RE
| Today | See what it's worth now |
| 1 Apr 2026 | £142,000 |
| 7 Jul 2003 | £85,000 |
5, Ledbury Road, Blackpool FY3 7SR
| Today | See what it's worth now |
| 31 Mar 2026 | £139,000 |
| 15 Nov 2011 | £110,000 |
1, Wensleydale Avenue, Blackpool FY3 7RS
| Today | See what it's worth now |
| 31 Mar 2026 | £128,000 |
| 31 Mar 2026 | £128,000 |
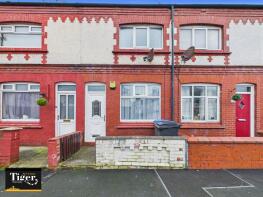
183, Layton Road, Blackpool FY3 8ES
| Today | See what it's worth now |
| 31 Mar 2026 | £140,000 |
| 10 Apr 2024 | £75,000 |
No other historical records.
45, Sherwood Avenue, Blackpool FY3 7HT
| Today | See what it's worth now |
| 27 Mar 2026 | £122,000 |
| 29 Sep 2003 | £66,000 |
No other historical records.
28, Grange Road, Blackpool FY3 8EJ
| Today | See what it's worth now |
| 23 Mar 2026 | £112,000 |
| 20 Jun 2011 | £84,000 |
15, Moreton Drive, Blackpool FY3 0DR
| Today | See what it's worth now |
| 23 Mar 2026 | £241,000 |
| 16 Aug 2021 | £172,000 |
26, Conway Avenue, Blackpool FY3 7SF
| Today | See what it's worth now |
| 20 Mar 2026 | £165,000 |
| 17 Aug 2012 | £90,000 |
No other historical records.
233, Preston Old Road, Blackpool FY3 9UW
| Today | See what it's worth now |
| 13 Mar 2026 | £108,000 |
| 28 May 2004 | £86,500 |
30, Baines Avenue, Blackpool FY3 7LA
| Today | See what it's worth now |
| 13 Mar 2026 | £130,000 |
No other historical records.
21, Sandpiper Close, Blackpool FY3 8FJ
| Today | See what it's worth now |
| 13 Mar 2026 | £185,000 |
| 22 Oct 1999 | £81,950 |
No other historical records.
4, Elkfield Drive, Blackpool FY3 7RG

| Today | See what it's worth now |
| 13 Mar 2026 | £149,995 |
| 8 Nov 2023 | £133,550 |

Source Acknowledgement: © Crown copyright. England and Wales house price data is publicly available information produced by the HM Land Registry.This material was last updated on 9 July 2026. It covers the period from 1 January 1995 to 30 April 2026 and contains property transactions which have been registered during that period. Contains HM Land Registry data © Crown copyright and database right 2026. This data is licensed under the Open Government Licence v3.0.
Disclaimer: Rightmove.co.uk provides this HM Land Registry data "as is". The burden for fitness of the data relies completely with the user and is provided for informational purposes only. No warranty, express or implied, is given relating to the accuracy of content of the HM Land Registry data and Rightmove does not accept any liability for error or omission. If you have found an error with the data or need further information please contact HM Land Registry.
Permitted Use: Viewers of this Information are granted permission to access this Crown copyright material and to download it onto electronic, magnetic, optical or similar storage media provided that such activities are for private research, study or in-house use only. Any other use of the material requires the formal written permission of Land Registry which can be requested from us, and is subject to an additional licence and associated charge.
Rightmove takes no liability for your use of, or reliance on, Rightmove's Instant Valuation due to the limitations of our tracking tool listed here. Use of this tool is taken entirely at your own risk. All rights reserved.