
House Prices in GL11
House prices in GL11 have an overall average of £348,692 over the last year.
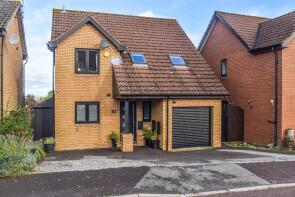
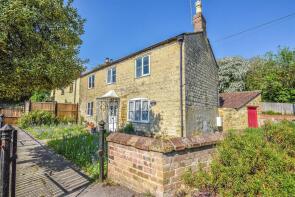
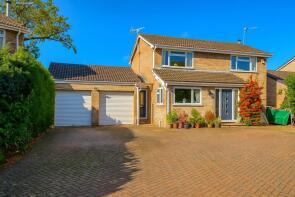
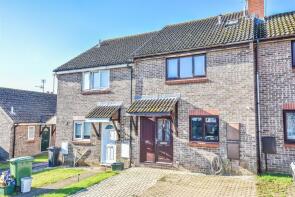
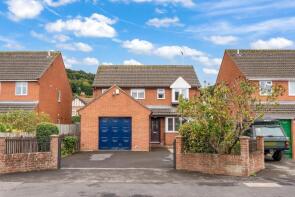
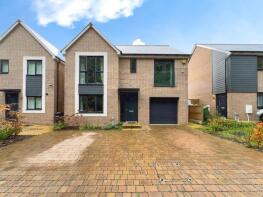
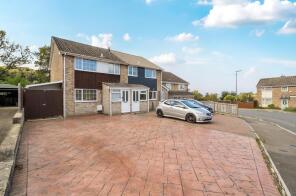
The majority of properties sold in GL11 during the last year were detached properties, selling for an average price of £487,011. Semi-detached properties sold for an average of £305,880, with terraced properties fetching £251,138.
Overall, the historical sold prices in GL11 over the last year were 2% up on the previous year and 7% down on the 2023 peak of £374,741.
Properties Sold
7, Beyon Drive, Dursley GL11 5JW
| Today | See what it's worth now |
| 24 Apr 2026 | £345,000 |
| 2 Apr 2015 | £208,000 |
28, The Hawthorns, Dursley GL11 5LJ
| Today | See what it's worth now |
| 24 Apr 2026 | £470,000 |
| 12 Oct 2018 | £325,000 |
10, Tilsdown, Dursley GL11 5QL
| Today | See what it's worth now |
| 22 Apr 2026 | £325,000 |
| 13 May 2011 | £147,500 |
Extensions and planning permission in GL11
See planning approval stats, extension build costs and value added estimates.

35, Rosebery Road, Dursley GL11 4PT
| Today | See what it's worth now |
| 21 Apr 2026 | £245,000 |
| 9 Jun 2017 | £175,031 |
32, The Close, Dursley GL11 5EP
| Today | See what it's worth now |
| 20 Apr 2026 | £530,000 |
| 19 Jan 2012 | £321,000 |
No other historical records.
The Chimes, Forthay, Dursley GL11 6DY
| Today | See what it's worth now |
| 16 Apr 2026 | £382,250 |
| 13 Dec 2011 | £249,950 |
7, Barrs Lane, Dursley GL11 6DT
| Today | See what it's worth now |
| 14 Apr 2026 | £480,000 |
| 23 Jul 2010 | £290,000 |
No other historical records.
36, Rowley, Dursley GL11 5NT
| Today | See what it's worth now |
| 10 Apr 2026 | £325,000 |
| 14 Sep 2021 | £275,000 |
21, Jubilee Close, Dursley GL11 5JQ
| Today | See what it's worth now |
| 9 Apr 2026 | £275,000 |
| 27 Aug 2021 | £225,000 |
Nordensdal, New Road, Dursley GL11 6DR
| Today | See what it's worth now |
| 2 Apr 2026 | £450,000 |
| 17 Feb 2017 | £266,000 |
50, Long Street, Dursley GL11 4JB
| Today | See what it's worth now |
| 2 Apr 2026 | £143,000 |
| 24 Aug 2018 | £115,000 |
Forthay House, Forthay, North Nibley GL11 6EA
| Today | See what it's worth now |
| 2 Apr 2026 | £955,000 |
No other historical records.
8, Rangers Avenue, Dursley GL11 4AS
| Today | See what it's worth now |
| 31 Mar 2026 | £295,000 |
| 1 Dec 2023 | £266,000 |
28, Cam Green, Dursley GL11 5HN
| Today | See what it's worth now |
| 27 Mar 2026 | £530,000 |
| 3 Aug 2017 | £380,000 |
1, Phelps Mill Close, Dursley GL11 4GA

| Today | See what it's worth now |
| 24 Mar 2026 | £155,000 |
| 20 Dec 2018 | £145,000 |
4, May Evans Close, Dursley GL11 5UX
| Today | See what it's worth now |
| 16 Mar 2026 | £237,500 |
| 25 Feb 2021 | £207,000 |
35, Woodfield Road, Dursley GL11 6HD
| Today | See what it's worth now |
| 16 Mar 2026 | £357,500 |
| 11 Feb 2011 | £216,500 |
No other historical records.
27, Foundry Rise, Dursley GL11 4HJ
| Today | See what it's worth now |
| 13 Mar 2026 | £445,000 |
| 5 Oct 2023 | £467,995 |
No other historical records.
4, Tennyson Road, Dursley GL11 4PZ
| Today | See what it's worth now |
| 13 Mar 2026 | £330,000 |
| 22 May 1997 | £53,500 |
No other historical records.
85, Woodmancote, Dursley GL11 4AG
| Today | See what it's worth now |
| 13 Mar 2026 | £343,000 |
| 17 Mar 2023 | £335,000 |
10, Wyatt Close, Dursley GL11 4FE
| Today | See what it's worth now |
| 12 Mar 2026 | £375,000 |
| 27 Feb 2020 | £314,995 |
No other historical records.
56, Budding Way, Dursley GL11 5BE
| Today | See what it's worth now |
| 12 Mar 2026 | £373,000 |
| 12 May 2017 | £282,995 |
No other historical records.
Rose Cottage, Haw Street, Dursley GL11 5AY

| Today | See what it's worth now |
| 6 Mar 2026 | £950,000 |
| 29 Apr 2010 | £460,000 |
No other historical records.
Source Acknowledgement: © Crown copyright. England and Wales house price data is publicly available information produced by the HM Land Registry.This material was last updated on 9 July 2026. It covers the period from 1 January 1995 to 30 April 2026 and contains property transactions which have been registered during that period. Contains HM Land Registry data © Crown copyright and database right 2026. This data is licensed under the Open Government Licence v3.0.
Disclaimer: Rightmove.co.uk provides this HM Land Registry data "as is". The burden for fitness of the data relies completely with the user and is provided for informational purposes only. No warranty, express or implied, is given relating to the accuracy of content of the HM Land Registry data and Rightmove does not accept any liability for error or omission. If you have found an error with the data or need further information please contact HM Land Registry.
Permitted Use: Viewers of this Information are granted permission to access this Crown copyright material and to download it onto electronic, magnetic, optical or similar storage media provided that such activities are for private research, study or in-house use only. Any other use of the material requires the formal written permission of Land Registry which can be requested from us, and is subject to an additional licence and associated charge.
Rightmove takes no liability for your use of, or reliance on, Rightmove's Instant Valuation due to the limitations of our tracking tool listed here. Use of this tool is taken entirely at your own risk. All rights reserved.