
House Prices in Gluocester
House prices in Gluocester have an overall average of £319,185 over the last year.
The majority of properties sold in Gluocester during the last year were semi-detached properties, selling for an average price of £322,524. Detached properties sold for an average of £504,542, with flats fetching £133,364.
Overall, the historical sold prices in Gluocester over the last year were 1% down on the previous year and 3% up on the 2023 peak of £310,925.
Properties Sold
16, Oak Way, Gloucester GL19 3SD
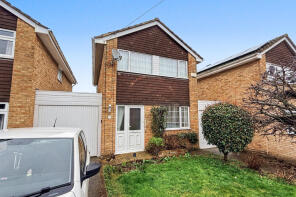
| Today | See today's value |
| 20 Aug 2026 | £280,000 |
| 19 Sep 2014 | £182,500 |
No other historical records.
6, The Dell, Gloucester GL4 3FT
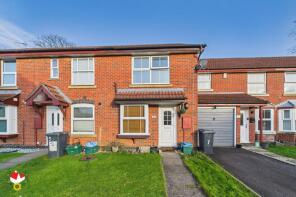
| Today | See today's value |
| 12 Aug 2026 | £205,000 |
| 11 Jun 2010 | £129,500 |
12, Colerne Drive, Hucclecote, Gloucester GL3 3SX
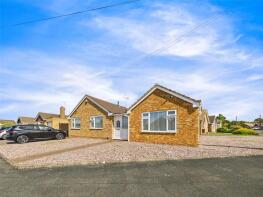
| Today | See today's value |
| 12 Aug 2026 | £455,000 |
| 19 Dec 2003 | £173,000 |
56, Hamer Street, Gloucester GL1 3QN
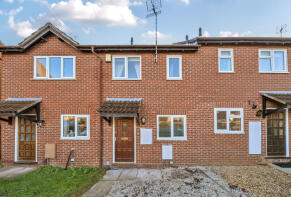
| Today | See today's value |
| 7 Aug 2026 | £190,000 |
| 5 Nov 2010 | £125,000 |
83, Pinemount Road, Hucclecote, Gloucester GL3 3EJ
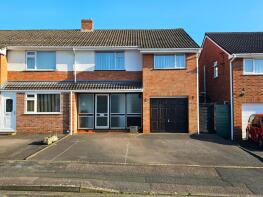
| Today | See today's value |
| 6 Aug 2026 | £302,000 |
No other historical records.
54, Insley Gardens, Gloucester GL3 3AY
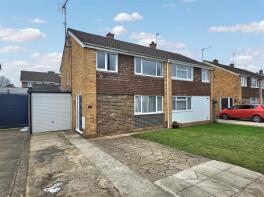
| Today | See today's value |
| 3 Aug 2026 | £317,000 |
| 27 Jun 2022 | £285,500 |
Foscombe House, Foscombe Lane, Ashleworth, Gloucester GL19 4JN
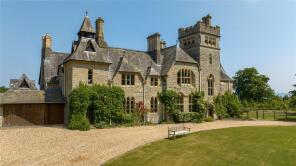
| Today | See today's value |
| 31 Jul 2026 | £4,800,000 |
| 31 Mar 2011 | £3,000,000 |
No other historical records.
6, Porchester Road, Gloucester GL3 3EB
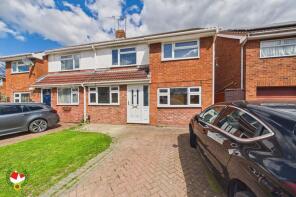
| Today | See today's value |
| 31 Jul 2026 | £294,000 |
| 25 Mar 1999 | £67,000 |
No other historical records.
1, Laburnum Villas, Gloucester GL19 3FB

| Today | See today's value |
| 30 Jul 2026 | £375,000 |
| 18 Mar 2022 | £375,000 |
No other historical records.
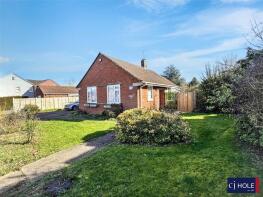
27, Dinglewell, Hucclecote, Gloucester GL3 3HW
| Today | See today's value |
| 28 Jul 2026 | £370,000 |
No other historical records.
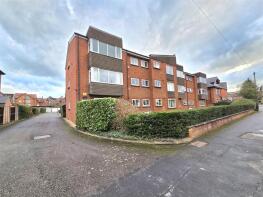
13, The Firs, Heathville Road, Gloucester GL1 3EW
| Today | See today's value |
| 24 Jul 2026 | £150,000 |
| 26 Nov 2021 | £145,000 |
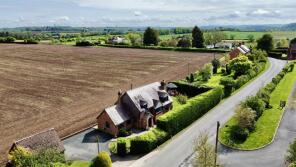
Cider Apple Cottage, Tibberton Lane, Gloucester GL2 8DZ
| Today | See today's value |
| 23 Jul 2026 | £580,000 |
| 11 Nov 2005 | £387,500 |
No other historical records.
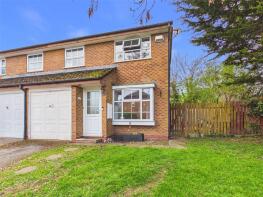
30, Coxs Way, Gloucester GL4 5LF
| Today | See today's value |
| 17 Jul 2026 | £280,000 |
| 2 Aug 2018 | £219,000 |
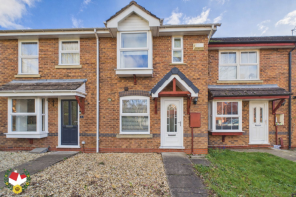
10, The Holt, Gloucester GL4 3FJ
| Today | See today's value |
| 17 Jul 2026 | £222,500 |
| 5 Aug 2022 | £220,000 |
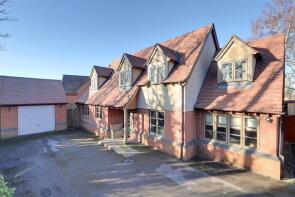
9, Watts Close, Gloucester GL3 3RJ
| Today | See today's value |
| 16 Jul 2026 | £520,000 |
| 14 Feb 2014 | £356,000 |
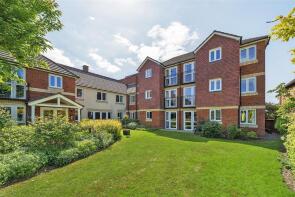
Flat 11, Hamlet Lodge, Heathville Road, Gloucester GL1 3ET
| Today | See today's value |
| 15 Jul 2026 | £155,000 |
| 27 May 2011 | £184,950 |
No other historical records.
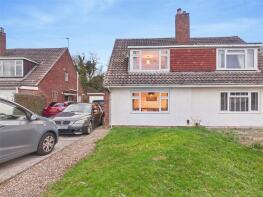
34, Gilpin Avenue, Gloucester GL3 3DE
| Today | See today's value |
| 13 Jul 2026 | £280,000 |
| 12 Feb 2021 | £230,000 |
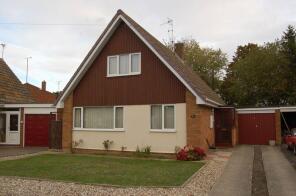
85, Sussex Gardens, Hucclecote, Gloucester GL3 3SP
| Today | See today's value |
| 13 Jul 2026 | £350,000 |
| 27 Apr 2012 | £187,000 |
No other historical records.
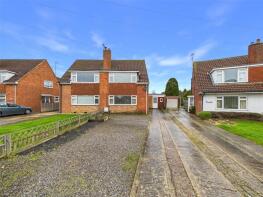
115, Chosen Way, Gloucester GL3 3BX
| Today | See today's value |
| 10 Jul 2026 | £330,000 |
| 24 May 2019 | £255,000 |
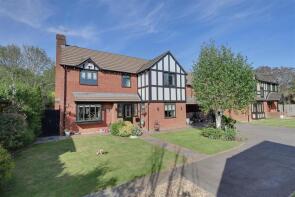
6, The Orchards, Gloucester GL3 3RL
| Today | See today's value |
| 9 Jul 2026 | £710,000 |
| 27 Jan 2023 | £600,000 |
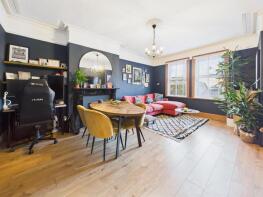
Flat 2, 59, Denmark Road, Gloucester GL1 3JJ
| Today | See today's value |
| 9 Jul 2026 | £145,000 |
| 9 Apr 2023 | £140,000 |
32, Dodington Close, Gloucester GL4 3JG
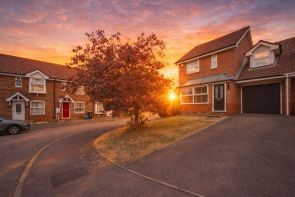
| Today | See today's value |
| 8 Jul 2026 | £305,000 |
| 9 Feb 2021 | £255,000 |
28, Barrington Drive, Hucclecote, Gloucester GL3 3BT
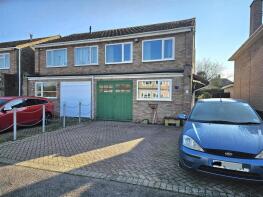
| Today | See today's value |
| 7 Jul 2026 | £280,000 |
No other historical records.

Rightmove takes no liability for your use of, or reliance on, Rightmove's Instant Valuation due to the limitations of our tracking tool listed here. Use of this tool is taken entirely at your own risk. All rights reserved.