
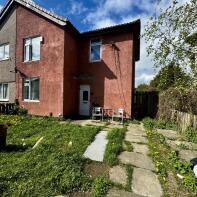
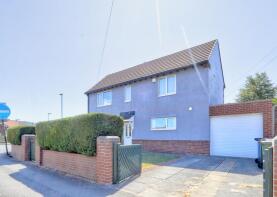
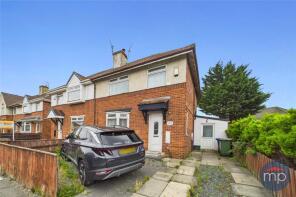
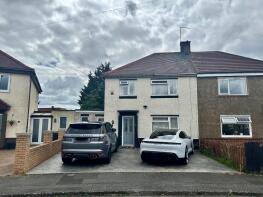
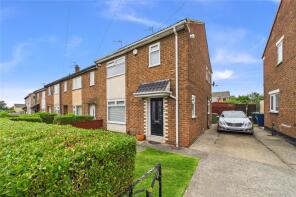
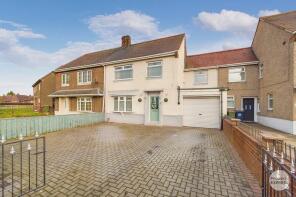
House Prices in Grangetown
House prices in Grangetown have an overall average of £88,900 over the last year.
The majority of properties sold in Grangetown during the last year were semi-detached properties, selling for an average price of £88,950. Terraced properties sold for an average of £88,750.
Overall, the historical sold prices in Grangetown over the last year were 11% up on the previous year and 10% up on the 2022 peak of £81,063.
Properties Sold
27, Langdale Crescent, Middlesbrough TS6 7RF
| Today | See what it's worth now |
| 23 Mar 2026 | £109,000 |
| 15 May 2024 | £105,000 |
28, Leighton Road, Middlesbrough TS6 7HQ
| Today | See what it's worth now |
| 10 Mar 2026 | £39,900 |
| 17 Apr 2007 | £22,000 |
78, Attlee Road, Grangetown TS6 7NA
| Today | See what it's worth now |
| 6 Mar 2026 | £115,000 |
No other historical records.
60, Arundel Road, Middlesbrough TS6 7QZ
| Today | See what it's worth now |
| 27 Feb 2026 | £88,500 |
| 25 Jul 2013 | £51,000 |
19, Shaw Crescent, Middlesbrough TS6 7LW
| Today | See what it's worth now |
| 26 Jan 2026 | £108,000 |
| 18 Jun 2015 | £69,000 |
54, Clynes Road, Grangetown TS6 7RJ
| Today | See what it's worth now |
| 5 Dec 2025 | £92,000 |
No other historical records.
11, Cheddar Close, Middlesbrough TS6 9SF
| Today | See what it's worth now |
| 19 Nov 2025 | £80,000 |
| 11 Aug 2021 | £40,500 |
66, Attlee Road, Grangetown TS6 7NA
| Today | See what it's worth now |
| 30 Oct 2025 | £100,000 |
No other historical records.
22, St Johns Row, Middlesbrough TS6 7HL
| Today | See what it's worth now |
| 22 Oct 2025 | £80,000 |
| 4 Jan 2011 | £63,996 |
No other historical records.
26, Eastcroft Road, Middlesbrough TS6 7ET
| Today | See what it's worth now |
| 20 Oct 2025 | £62,000 |
| 19 Aug 2014 | £32,000 |
No other historical records.
9, St Andrews Road West, Middlesbrough TS6 7JB
| Today | See what it's worth now |
| 6 Oct 2025 | £80,000 |
| 4 Nov 2016 | £45,000 |
No other historical records.
30, Robert Avenue, Middlesbrough TS6 7DU
| Today | See what it's worth now |
| 9 Sep 2025 | £48,000 |
| 31 Mar 2017 | £50,000 |
189, Birchington Avenue, Middlesbrough TS6 7LU
| Today | See what it's worth now |
| 29 Aug 2025 | £97,000 |
| 3 May 2013 | £61,000 |
4, Cheddar Close, Eston TS6 9SE
| Today | See what it's worth now |
| 10 Jul 2025 | £102,999 |
No other historical records.
19, Sandringham Road, Middlesbrough TS6 7QT
| Today | See what it's worth now |
| 4 Jul 2025 | £100,000 |
| 19 May 2006 | £80,000 |
15, Grisedale Crescent, Eston, Grangetown TS6 7QN

| Today | See what it's worth now |
| 20 Jun 2025 | £119,995 |
No other historical records.
9, Rydal Avenue, Middlesbrough TS6 7QG
| Today | See what it's worth now |
| 10 Mar 2025 | £44,000 |
| 1 Feb 2002 | £14,750 |
No other historical records.
59, Arundel Road, Middlesbrough TS6 7QZ
| Today | See what it's worth now |
| 7 Mar 2025 | £70,000 |
| 23 Aug 2002 | £28,500 |
No other historical records.
15a, St Georges Road West, Grangetown TS6 7HY
| Today | See what it's worth now |
| 4 Mar 2025 | £41,000 |
| 17 Sep 2007 | £50,000 |
141, Birchington Avenue, Middlesbrough TS6 7LL
| Today | See what it's worth now |
| 20 Feb 2025 | £123,000 |
| 2 Mar 2007 | £77,000 |
No other historical records.
14, Stafford Road, Middlesbrough TS6 7LJ

| Today | See what it's worth now |
| 14 Feb 2025 | £110,000 |
| 30 Jun 2006 | £85,000 |
No other historical records.
37, Langdale Crescent, Middlesbrough TS6 7RB

| Today | See what it's worth now |
| 31 Jan 2025 | £75,000 |
| 18 Dec 2020 | £69,000 |
75, Grisedale Crescent, Eston, Grangetown TS6 7QL

| Today | See what it's worth now |
| 29 Jan 2025 | £92,000 |
No other historical records.
Source Acknowledgement: © Crown copyright. England and Wales house price data is publicly available information produced by the HM Land Registry.This material was last updated on 15 May 2026. It covers the period from 1 January 1995 to 31 March 2026 and contains property transactions which have been registered during that period. Contains HM Land Registry data © Crown copyright and database right 2026. This data is licensed under the Open Government Licence v3.0.
Disclaimer: Rightmove.co.uk provides this HM Land Registry data "as is". The burden for fitness of the data relies completely with the user and is provided for informational purposes only. No warranty, express or implied, is given relating to the accuracy of content of the HM Land Registry data and Rightmove does not accept any liability for error or omission. If you have found an error with the data or need further information please contact HM Land Registry.
Permitted Use: Viewers of this Information are granted permission to access this Crown copyright material and to download it onto electronic, magnetic, optical or similar storage media provided that such activities are for private research, study or in-house use only. Any other use of the material requires the formal written permission of Land Registry which can be requested from us, and is subject to an additional licence and associated charge.
Rightmove takes no liability for your use of, or reliance on, Rightmove's Instant Valuation due to the limitations of our tracking tool listed here. Use of this tool is taken entirely at your own risk. All rights reserved.