
House Prices in Gumber
House prices in Gumber have an overall average of £394,571 over the last year.
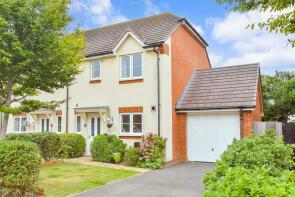
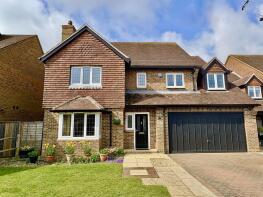
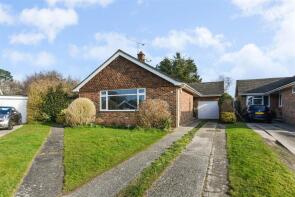
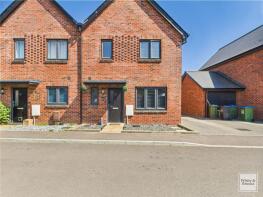
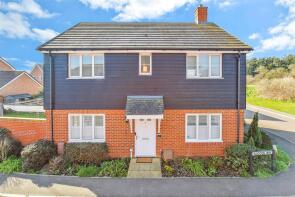
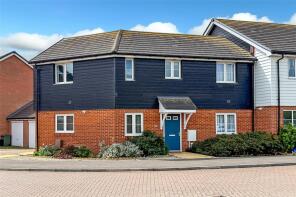
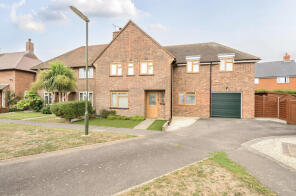
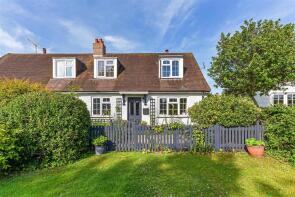
The majority of properties sold in Gumber during the last year were detached properties, selling for an average price of £486,970. Semi-detached properties sold for an average of £366,836, with terraced properties fetching £282,700.
Overall, the historical sold prices in Gumber over the last year were 7% down on the previous year and 10% down on the 2023 peak of £438,347.
Properties Sold
14, Dairy Lane, Arundel BN18 0PT
| Today | See what it's worth now |
| 22 Apr 2026 | £275,000 |
| 20 Dec 2004 | £85,000 |
No other historical records.
64, Johnson Way, Arundel BN18 0TS
| Today | See what it's worth now |
| 17 Apr 2026 | £240,000 |
| 2 Sep 2021 | £223,000 |
Foxgloves, Avisford Park Road, Arundel BN18 0AP
| Today | See what it's worth now |
| 16 Apr 2026 | £775,000 |
| 26 Oct 2018 | £630,000 |
Pump Cottage, Church Hill, Arundel BN18 0RD
| Today | See what it's worth now |
| 10 Apr 2026 | £805,000 |
| 31 May 2024 | £889,760 |
1, Burch Grove, Arundel BN18 0BB

| Today | See what it's worth now |
| 10 Apr 2026 | £335,000 |
| 9 Feb 2012 | £220,000 |
Highfield, Dairy Lane, Walberton BN18 0PT
| Today | See what it's worth now |
| 8 Apr 2026 | £475,000 |
No other historical records.
106, Navigation Drive, Arundel BN18 0FS
| Today | See what it's worth now |
| 31 Mar 2026 | £340,000 |
| 12 Apr 2019 | £315,000 |
31, Fairholme Drive, Arundel BN18 0JH
| Today | See what it's worth now |
| 30 Mar 2026 | £300,000 |
| 23 Aug 2010 | £160,000 |
No other historical records.
28, Charles Square, Cinders Lane, Arundel BN18 0XJ
| Today | See what it's worth now |
| 30 Mar 2026 | £320,000 |
| 28 May 2021 | £295,000 |
No other historical records.
6, Park Drive, Arundel BN18 0JF

| Today | See what it's worth now |
| 27 Mar 2026 | £335,000 |
| 19 Mar 2004 | £195,500 |
No other historical records.
32, Fellows Gardens, Arundel BN18 0HW
| Today | See what it's worth now |
| 24 Mar 2026 | £439,950 |
| 30 Jun 2021 | £370,000 |
1, West View Gardens, Arundel BN18 0JS

| Today | See what it's worth now |
| 23 Mar 2026 | £291,000 |
| 13 Sep 2024 | £275,000 |
26, Fellows Gardens, Arundel BN18 0HW
| Today | See what it's worth now |
| 20 Mar 2026 | £320,000 |
| 25 Jan 2016 | £272,995 |
No other historical records.
40, Pearson Road, Arundel BN18 9HR
| Today | See what it's worth now |
| 12 Mar 2026 | £360,000 |
| 30 Oct 2009 | £235,000 |
3, Junction Close, Arundel BN18 0TE
| Today | See what it's worth now |
| 6 Mar 2026 | £259,000 |
| 22 Feb 2019 | £215,500 |
23, Fellows Gardens, Arundel BN18 0HW
| Today | See what it's worth now |
| 2 Mar 2026 | £337,000 |
| 1 Jun 2020 | £286,000 |
11, Hunters Mews, Arundel BN18 0UW
| Today | See what it's worth now |
| 2 Mar 2026 | £710,000 |
| 12 Jun 2017 | £570,000 |
16, Long Mead, Arundel BN18 0QG
| Today | See what it's worth now |
| 23 Feb 2026 | £417,500 |
| 10 Apr 2000 | £172,000 |
24, Charles Square, Cinders Lane, Arundel BN18 0XJ
| Today | See what it's worth now |
| 20 Feb 2026 | £337,500 |
| 28 May 2021 | £330,000 |
No other historical records.
6, Locks Way, Arundel BN18 0FY

| Today | See what it's worth now |
| 17 Feb 2026 | £365,000 |
| 22 Dec 2016 | £254,995 |
No other historical records.
2, Locks Way, Arundel BN18 0FY
| Today | See what it's worth now |
| 17 Feb 2026 | £395,000 |
| 20 Feb 2017 | £359,995 |
No other historical records.
80, Navigation Drive, Arundel BN18 0FS
| Today | See what it's worth now |
| 13 Feb 2026 | £330,000 |
| 23 Dec 2016 | £274,995 |
No other historical records.
39, Tack Lee Road, Arundel BN18 0HB
| Today | See what it's worth now |
| 6 Feb 2026 | £420,000 |
| 29 Jul 2016 | £255,000 |
No other historical records.
Source Acknowledgement: © Crown copyright. England and Wales house price data is publicly available information produced by the HM Land Registry.This material was last updated on 9 July 2026. It covers the period from 1 January 1995 to 30 April 2026 and contains property transactions which have been registered during that period. Contains HM Land Registry data © Crown copyright and database right 2026. This data is licensed under the Open Government Licence v3.0.
Disclaimer: Rightmove.co.uk provides this HM Land Registry data "as is". The burden for fitness of the data relies completely with the user and is provided for informational purposes only. No warranty, express or implied, is given relating to the accuracy of content of the HM Land Registry data and Rightmove does not accept any liability for error or omission. If you have found an error with the data or need further information please contact HM Land Registry.
Permitted Use: Viewers of this Information are granted permission to access this Crown copyright material and to download it onto electronic, magnetic, optical or similar storage media provided that such activities are for private research, study or in-house use only. Any other use of the material requires the formal written permission of Land Registry which can be requested from us, and is subject to an additional licence and associated charge.
Rightmove takes no liability for your use of, or reliance on, Rightmove's Instant Valuation due to the limitations of our tracking tool listed here. Use of this tool is taken entirely at your own risk. All rights reserved.